December 22, 2022

social, health, political imagery through the lens of G J Huba PhD © 2012-2021
December 22, 2022
It seems very obvious to me that the 2020 (now 2021) Olympics starting on July 23, 2021 should be a “no starter.”
Covid infection and death rates are again surging as Variant D spreads globally
Holding the Olympics could cost millions of lives. Worth it to you? Not to me.
Click the image to expand it.

Some other considerations.

by George J Huba PhD (Psychology)
This weekend the American Psychological Association is meeting in San Francisco. While certainly not exclusively so, the meeting tends to be dedicated to the presentation of fairly trivial and limited scope, poorly designed research studies.
Psychology should be embarrassed that the focus of the meeting is not developing new and better ways of addressing psychological problems. For instance, I have dementia. So do many millions of people worldwide. At this psychological meeting, there is little focus on actually improving the lives of persons with dementia. The same is true for many other psychological disorders.
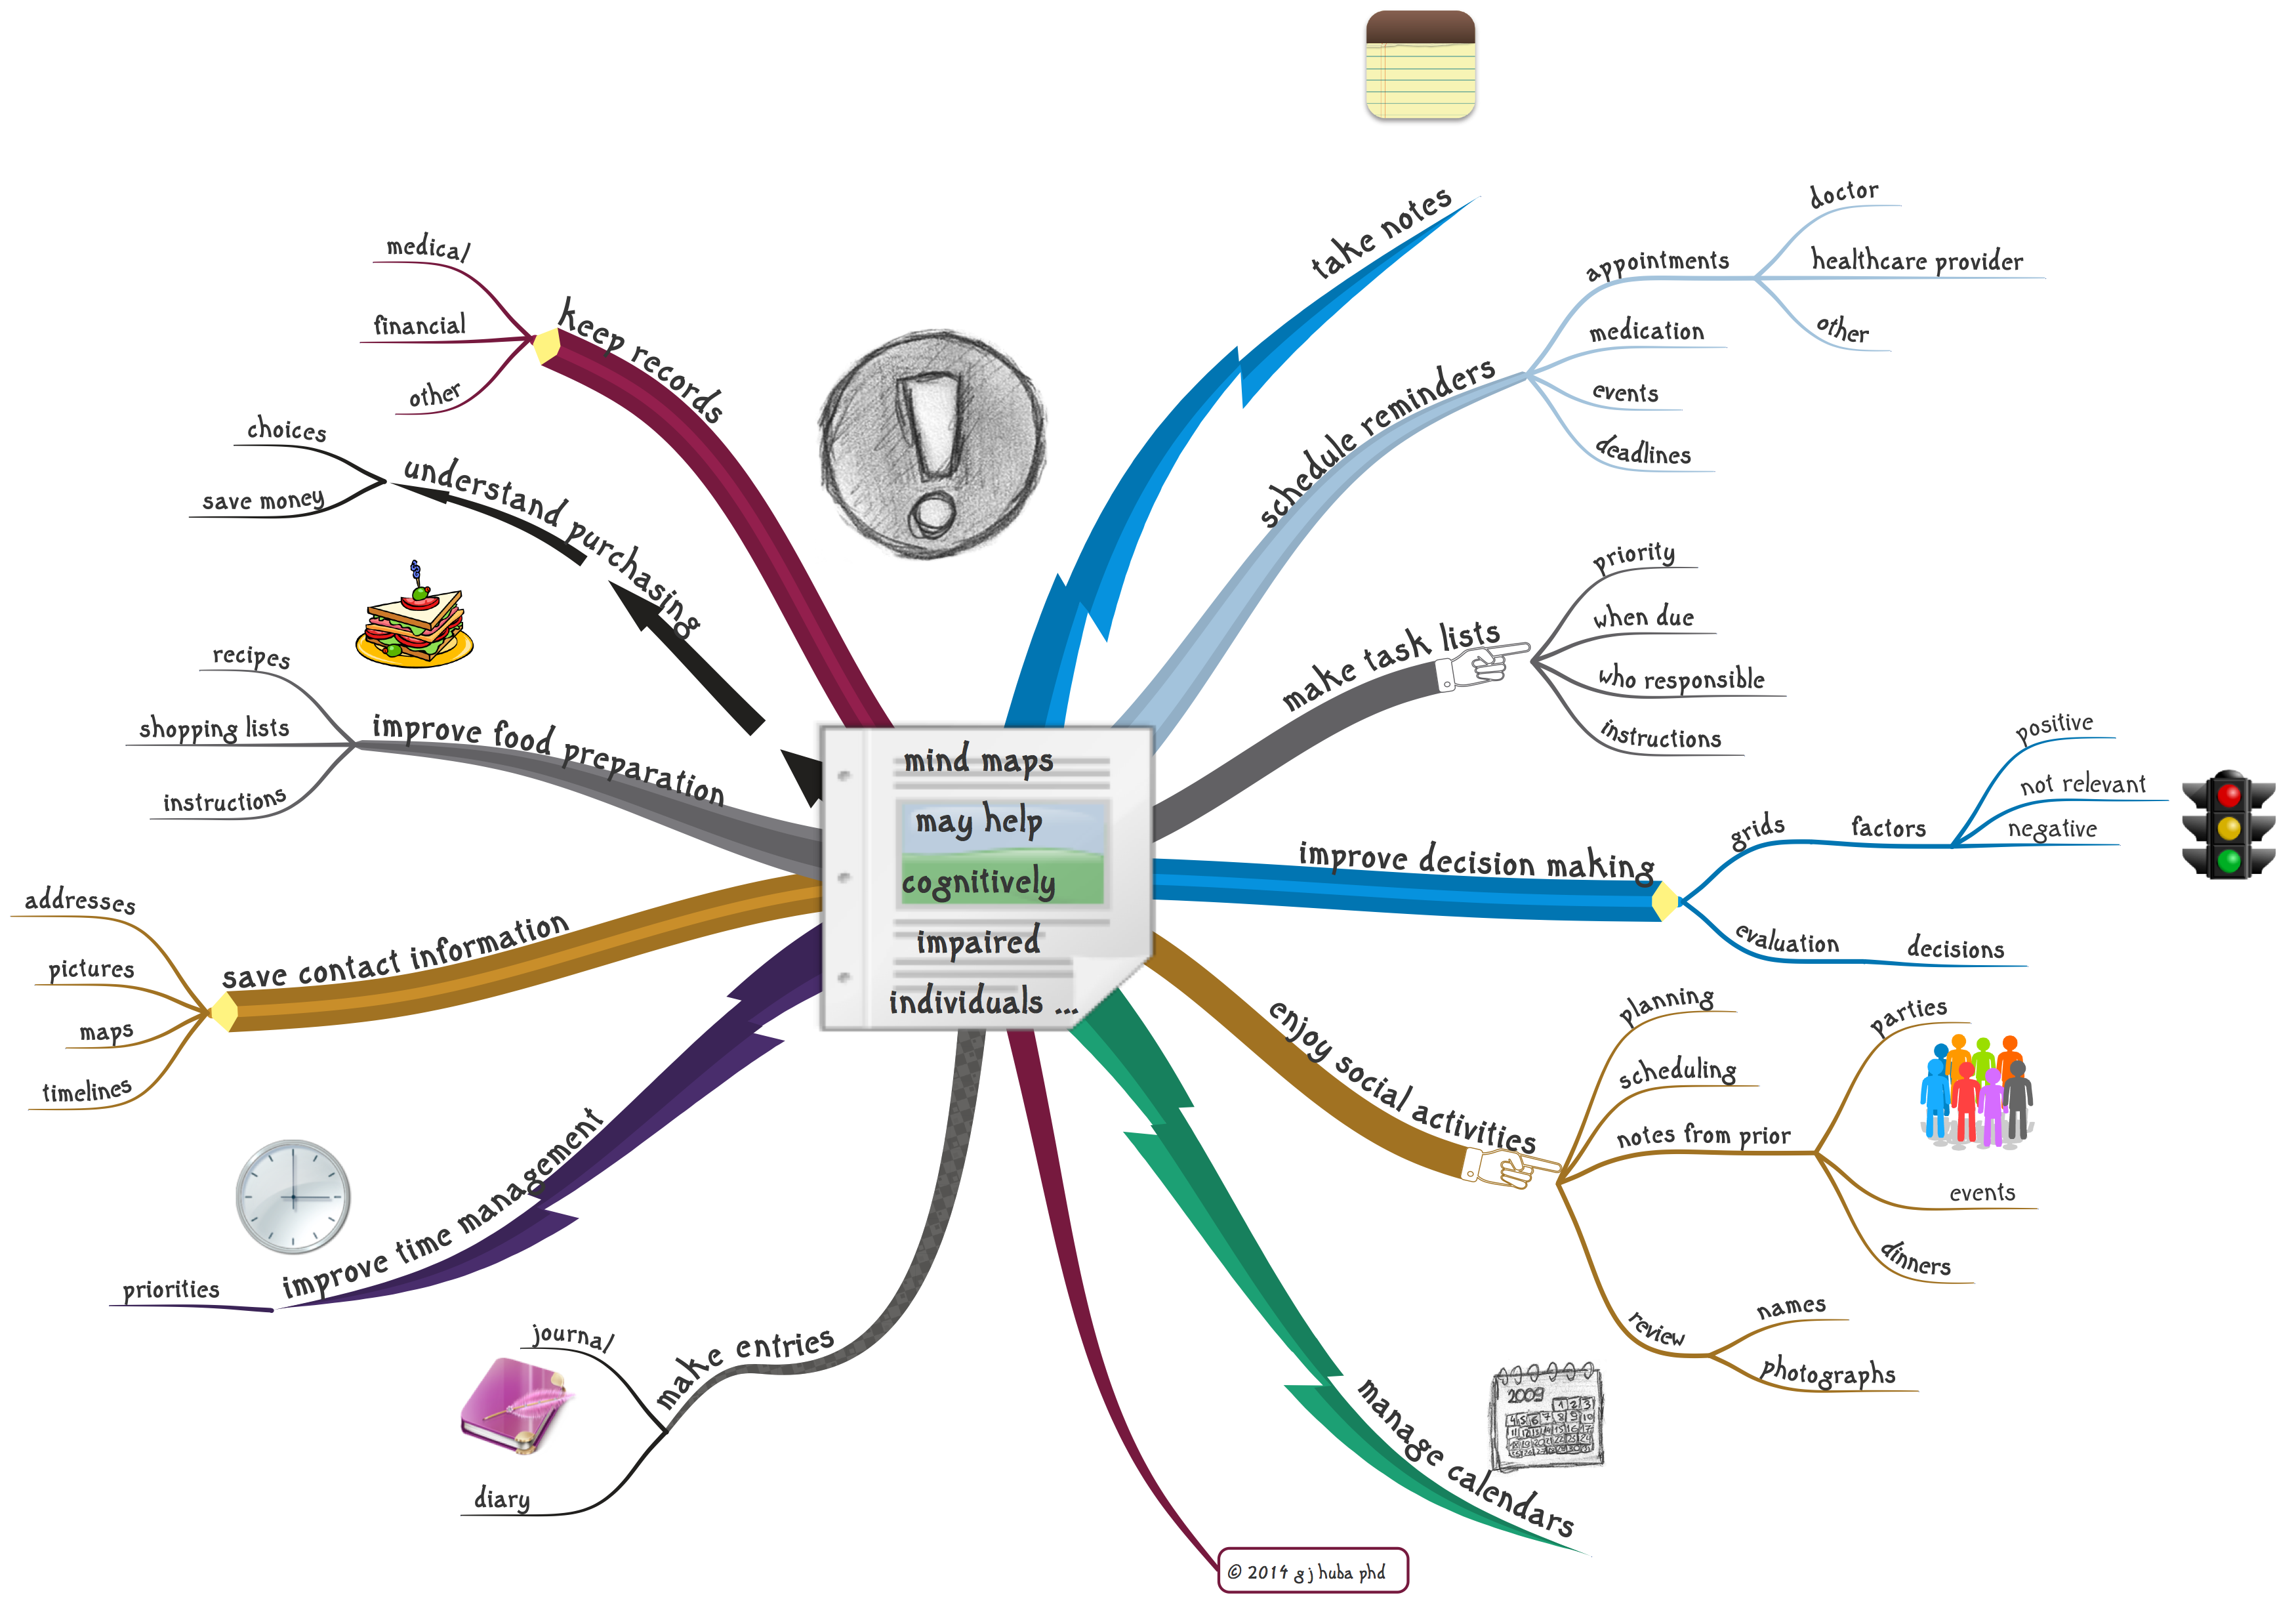
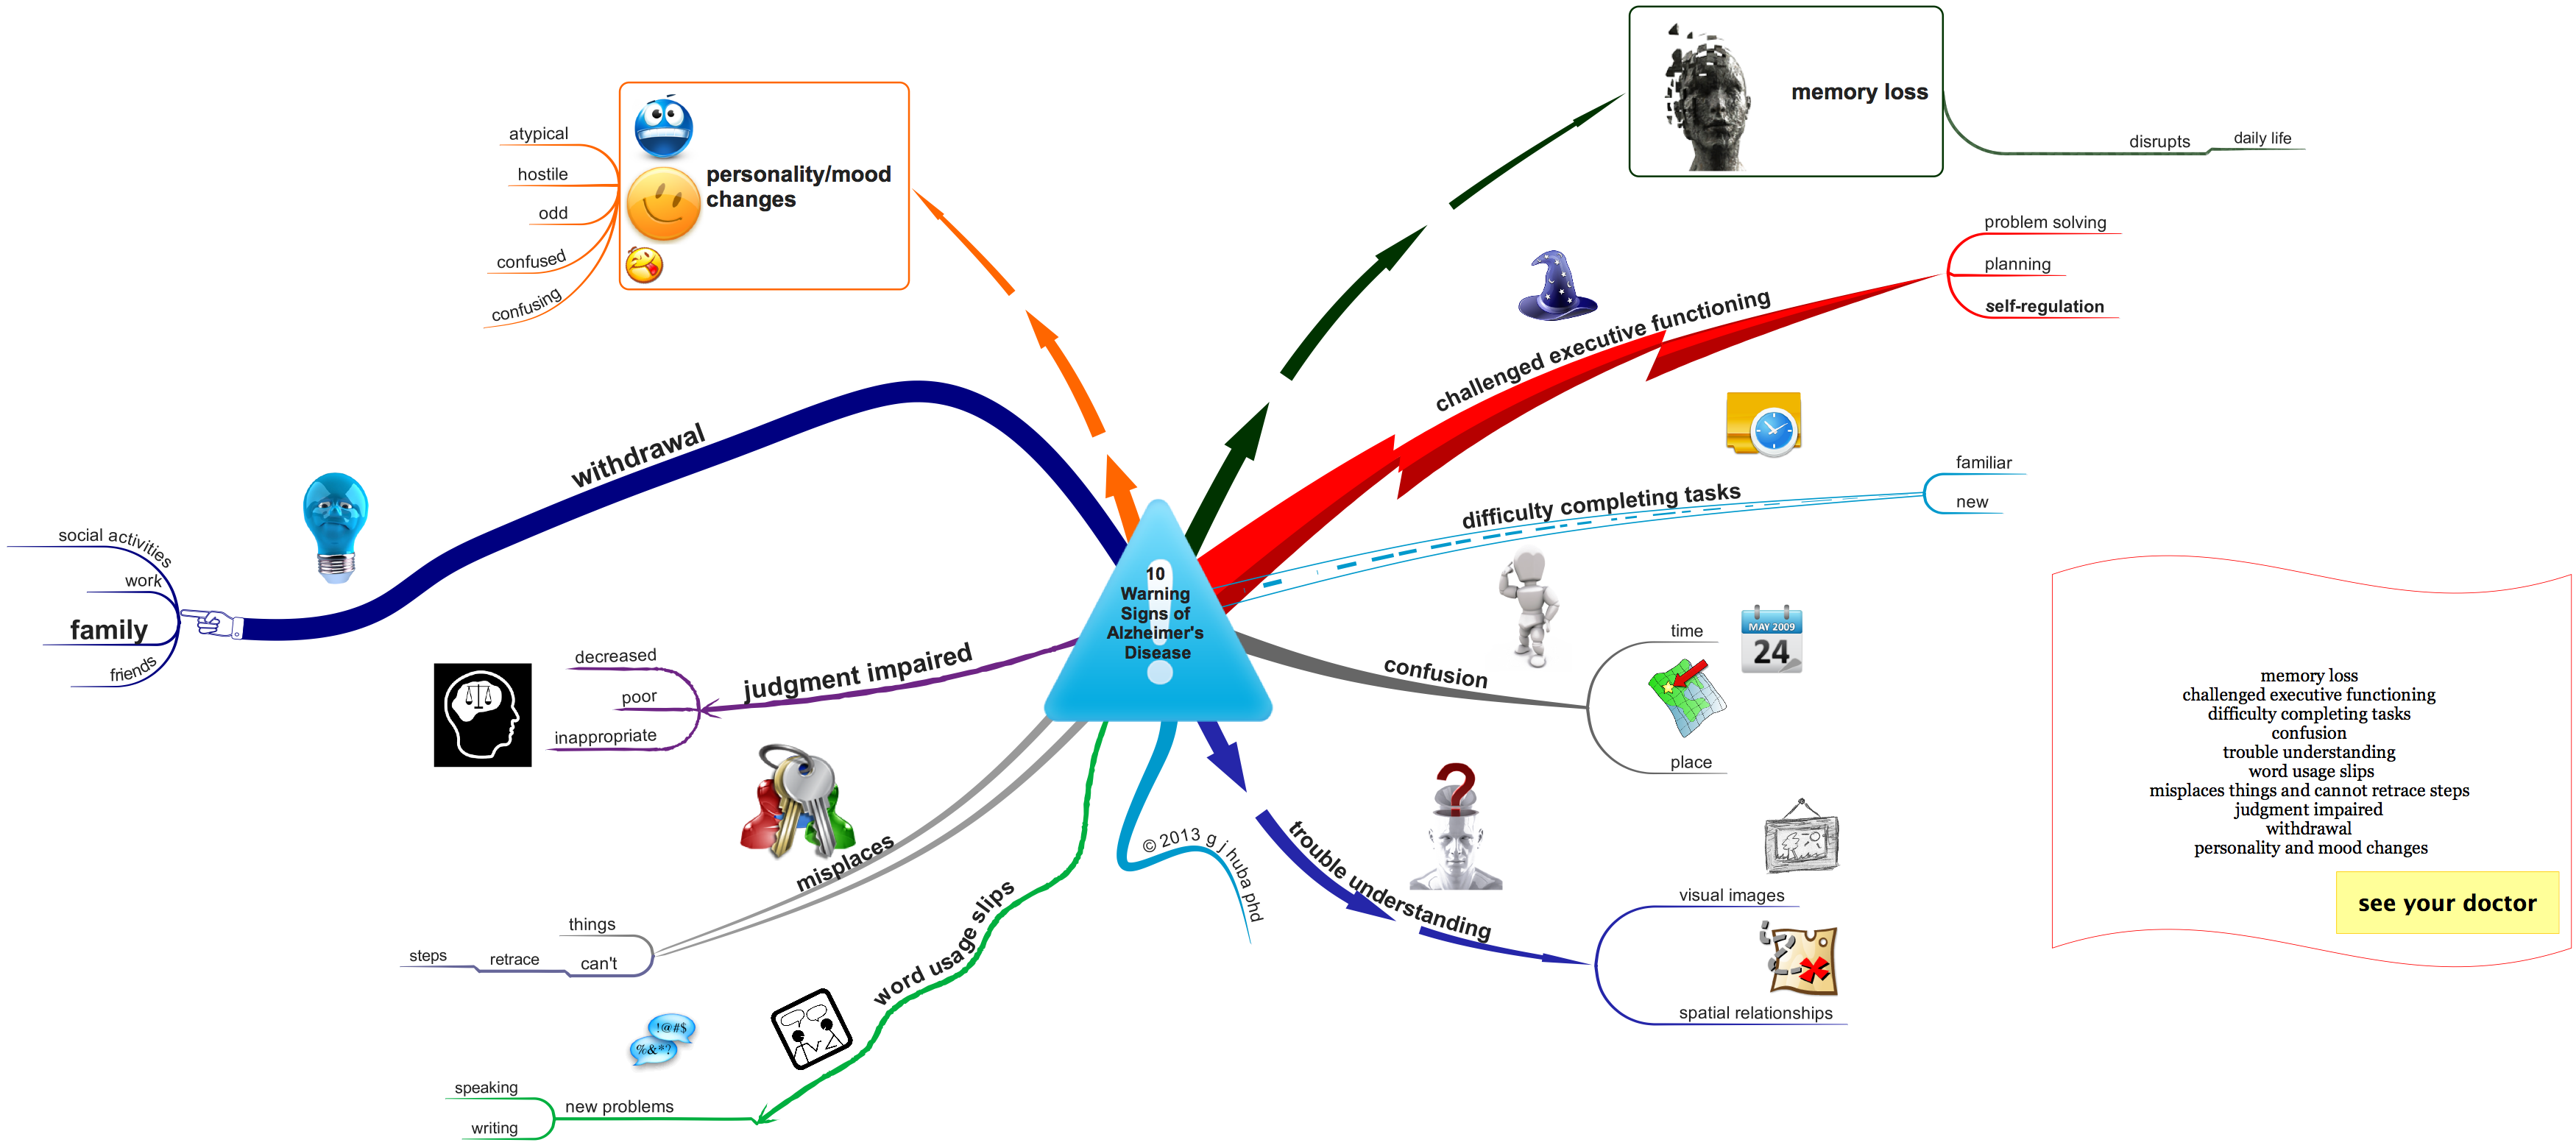
How has psychology failed persons with dementia? The following mind map presents my assessment of the situation.
Why does psychology fail persons with dementia? I believe it is because the field wants to pretend it is a science of the rigor of biology and physics, rather than focusing on becoming an evidence-based way of developing better ways of patient assessment, screening, treatment, and communication. What a waste. And remember that I am a person with degenerative cognitive and behavioral disease and I get it. Shame on psychology.
Click the image to expand it.

The #1 thing that I have learned over almost a decade of living with dementia is that thinking in pictures (images, diagrams, doodles, etc.) is much more effective than using words alone. Hedge your bet. Use pictures that associate with words rather than just words. After all, in many types of dementia, you lose your words at the end while the pictures may escape loss.
Try it. You will probably like it. Creating visualizations of important events, ideas, feelings, and other information can be FUN.
I’ve been using visual thinking methods for the past 10 years. They work (for me).

Want information you created or curated to have the greatest impact? Then put it into a mind map. Not a mono-toned mess of straight lines at right angles but curves with colors and an organic style. A mind map utilizing rules that follow what is fairly well known about visual thinking. A mind map like the one below.
Click on the image to expand it.

NOTE: Version 11 OF iMindMap was released the first week of May 2018. At this time (7-1-18) I have been using the program for about two months. I will have a full review posted within a week or two. As a brief note, Version 11 includes a number of enhancements. The program remains the best one for mind mapping and the updates made from Version 10 to 11 are significant and worth the upgrade price.
I doubt that there are many people expert in mind mapping who would disagree with me that iMindMap is the most feature-laden of the more than 100 programs for mind mapping to be found all over the Internet.
Once a year — as promised when the program was first introduced — iMindMap has a new release that provides many new features and usability enhancements. And unlike others, they produce a great upgrade every year on time. And free from most bugs that live in Cupertino and Redmond.
How good is iMindMap 10?
Click on the mind map (actually mind model in my terminology) below to expand its size. For those of you with no patience or dramatic sense of the big build-up, you can skip directly to the “9” branch. iMindMap is the 8,000-pound gorilla.
As a note, my review was conducted about six weeks after receiving the program and using it exclusively rather than earlier editions. I use a Mac only, and my review was conducted on a 2013 MacBook Pro. I have worked with the program both on an internal 15″ retina MacBook screen and a 27″ external monitor. [I actually like using the MacBook screen rather than the larger desktop monitor.]

Chris Griffiths and his team at OpenGenius have taken the work of Tony Buzan and in the process of developing a program expanded and formalized that conception in a creative way that is brilliant in its overall utility and ease of use. iMindMap 10 is my favorite mind mapping program, but most importantly my favorite and most useful thinking tool. For those of you who do not follow my blog in general, I live with Frontotemporal Dementia and iMindMap has served as a “brain assistance tool” for me since 2010 in daily living and in continuing my professional interests in a creative way. I can accurately say that the various versions of this program “changed my life.”
This is a tool formulated by expensive consultants who want to help corporations make more money while at the same profiting from that help. But the tool has come to greatly exceed the original vision and is intuitive to use and most adults and all children can learn to use the program for free using Internet trainings. Don’t be scared off by all of the publicity about a $3500 training and a certificate signed by a consulting firm (not an accredited educational institution). You do not need a course to learn this program and it is not clear to me that expensive courses help you learn to apply this program in the real world. If you are willing to invest a few hours you can be doing adequate mind maps; if you invest 10-20 hours you can be doing accomplished mind maps.
Get over the hype and realize that you CAN learn this program quickly on your own and even more rapidly if you study examples available without cost at many blogs including this one (Hubaisms.com), a depository of many thousands of mind maps at Biggerplate.com, and many other sites including youtube.com where many training sessions are presented.
While there are four “views” in this program, the primary mind mapping module is the reason for using this program. The other three views are largely alternate ways of looking at the same information and data. While they may be “quicker” ways to collect information together from a lecture or library research, at the end they feed their data into the mind mapping module where the actual thinking work, theory building, model development, and communication is done.
I have a few criticisms of the program, but these criticisms do NOT change my overall rating of the program as A+.
In summary, this is an amazing program that is much more than a program for mind mapping. It is unsurpassed among mind mapping programs. Additionally it is what I call a “visual thinking environment” or VITHEN. My “criticisms” are minor and do not in anyway diminish my overall evaluation of the quality of the program.
My blog at Hubaisms.com on which you are reading this review was designed and “written” largely in “iMindMap.” Most of the mind maps I use to guide my own “complicated” life were developed in iMindMap.
Exemplary job folks at OpenGenius. Version 10 is an additional large step in the evolution of the program and mind modeling.
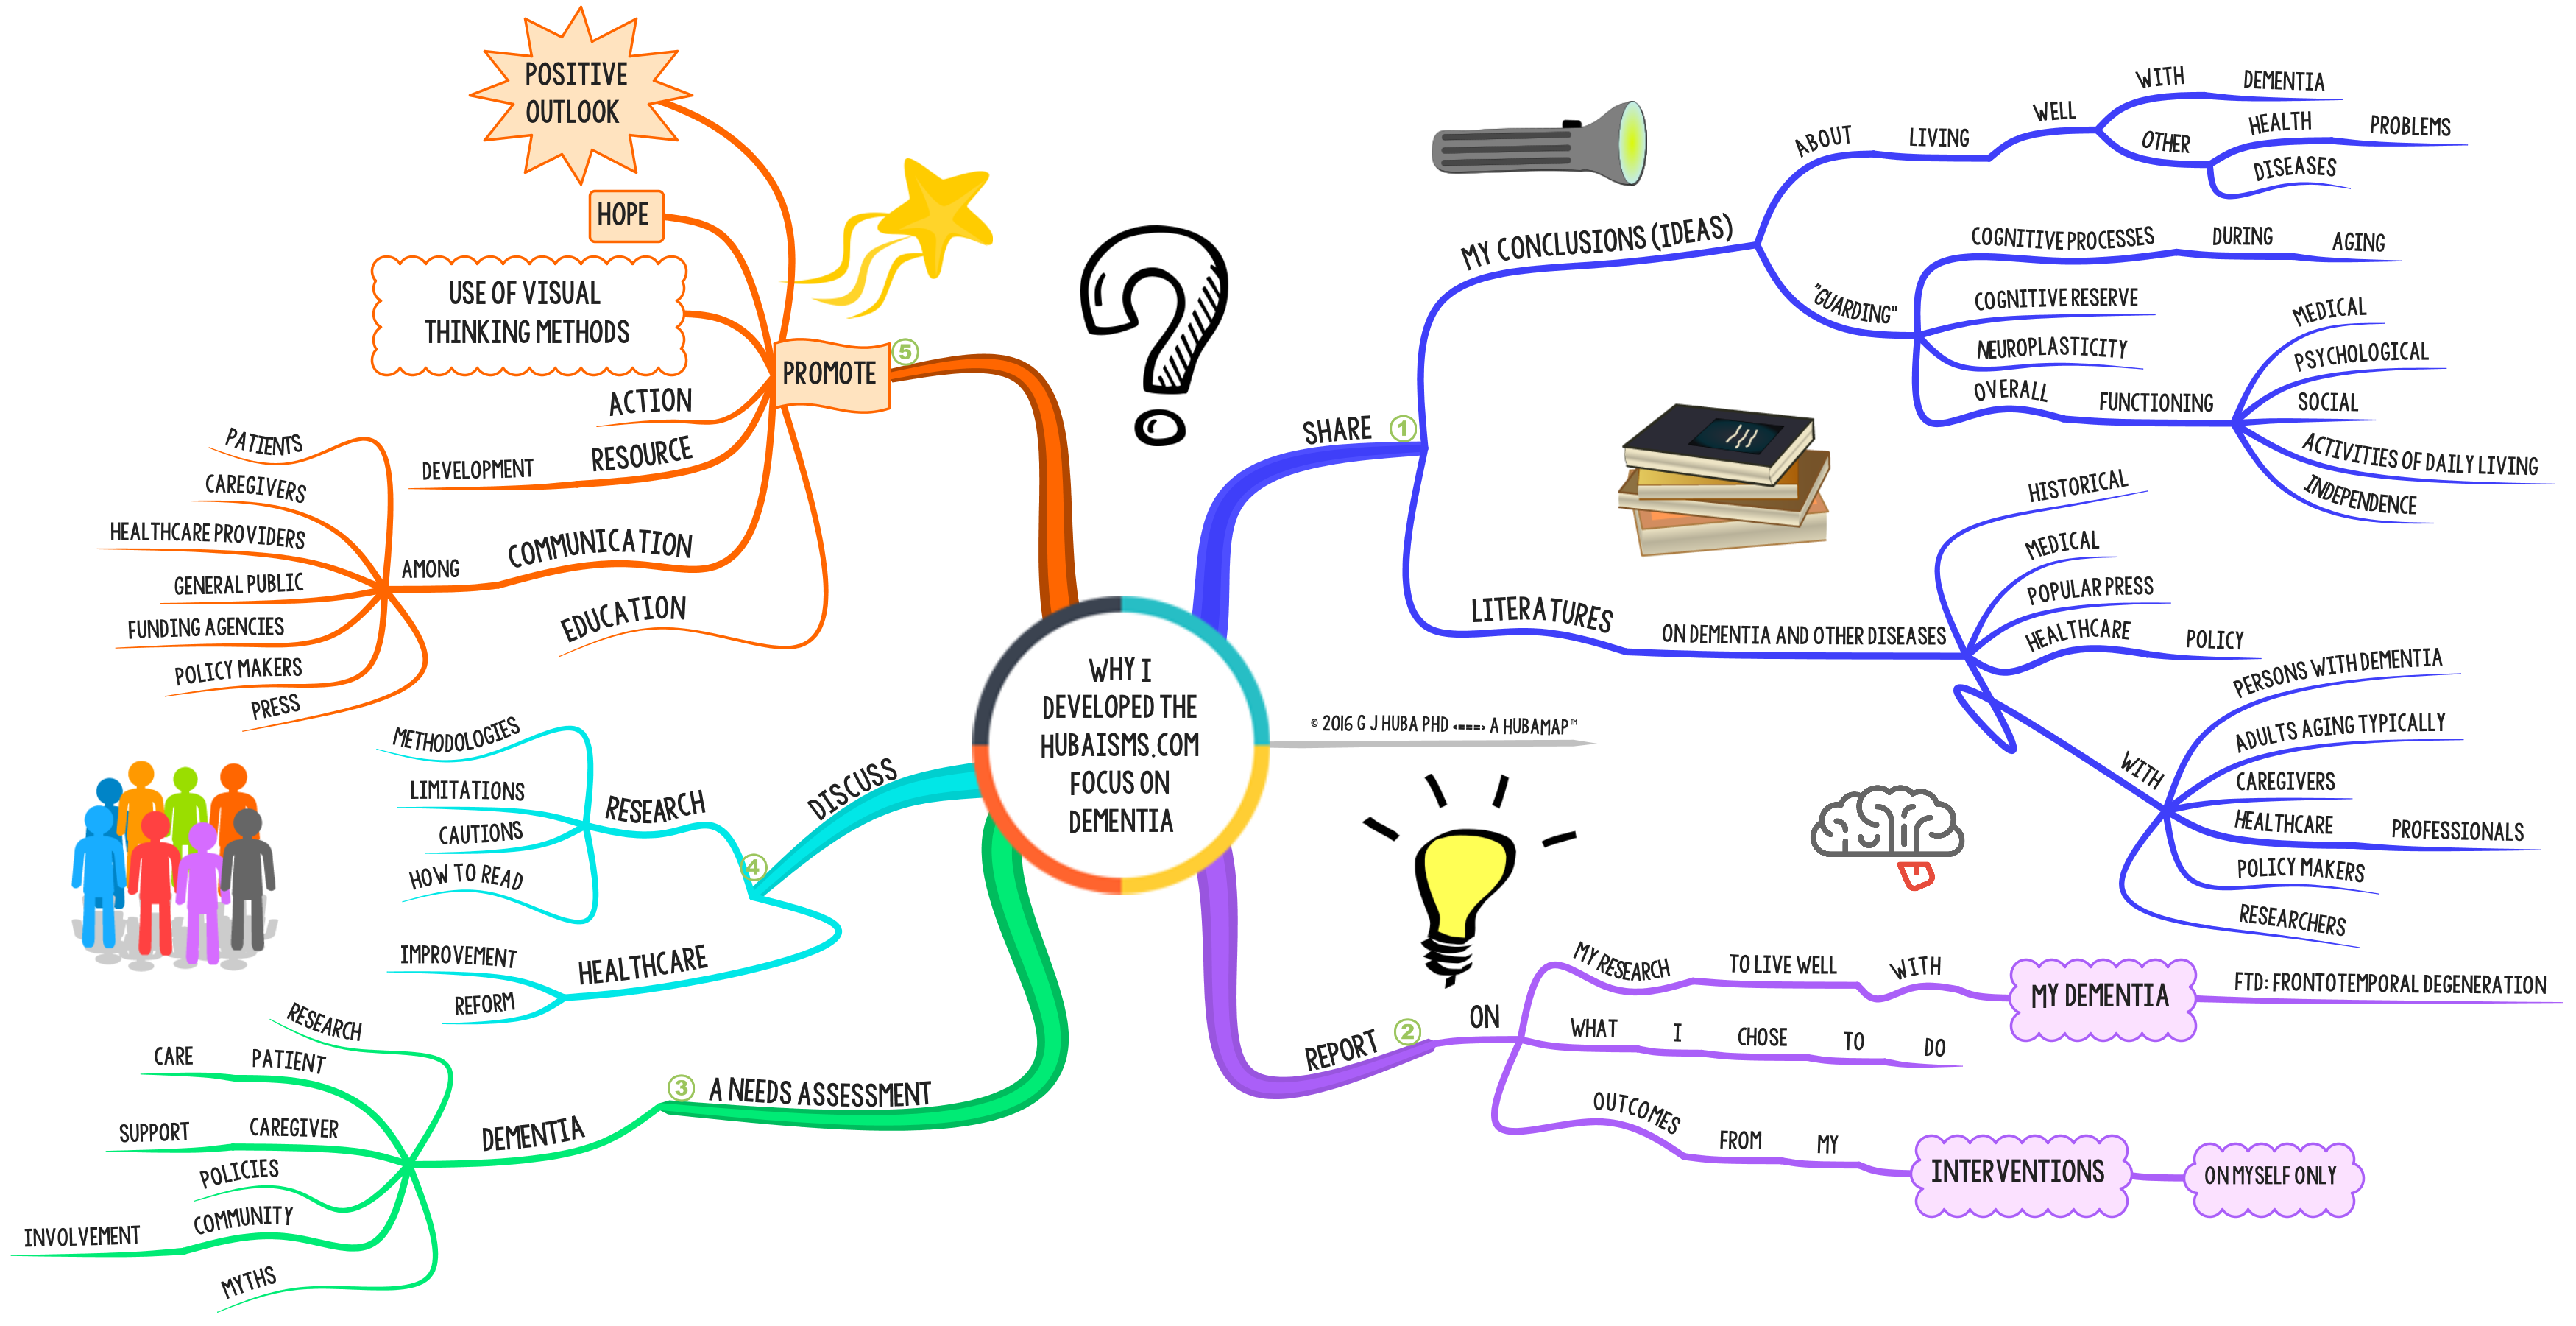
The mind model (aka mind map) below discusses my vision in developing the dementia focus on this website. I started to build the web site about two years after being diagnosed with a neurodegenerative condition (2012). Thus the entire blog is the work of a developer experiencing dementia while designing and preparing the content for the site. The site discusses my progression through cognitive impairment and decline into dementia. More importantly it discusses how I tried to help myself coordinate and use to full advantage the support and professional expertise made available to me by family, friends, the community, my doctors, and the general world-wide of patients and professionals the major issues.
Nothing in this blog post (or any other on blog post or page on the site) is intended to be, or promoted as medical, psychological, or any other form of treatment. The ideas in this blog are about using some commonsense note-taking and visual thinking methods to possible help you live better with dementia. I tried it on myself (only) and I am encouraged although I freely admit that full scientific study is needed.
These methods and comments will not substitute for medical and other professional treatments. They do not cure dementia. They do not slow down the progress of dementia. For me, at least, the methods have sustained and increased my quality of life and I do spend more time with my family and am more independent and in my opinion think better. But my dementia is not being treated and getting better; what I propose are methods that may make it easier to independently manage selected parts of your life, be in a better mood because you are trying to help yourself, be less of a burden to your caregivers, and report better to doctor what your experiences have been since the last appointment.
Many people are miserable almost all days when they have dementia. If simple, inexpensive cognitive tools can improve some or many of those days, the development of such techniques is a huge step forward.
I hope that others will examine the information here and use it to improve the decisions they, their caregivers, and their doctors and nurses must make about their formal medical treatment.
Here is what appears in the blog posts and elsewhere on Hubaisms.com.
Click on the image to expand it.
Click here to see Part 2 of My Vision in a separate window.
Not the past, not what might happen in the future. Fuzzy, intuitive, today’s emotions. Nonlinear, visual, big picture. Attention flows toward good, bright, happy visualizations.

Opening your mind to nonlinear thinking may provide a cognitive reserve that helps you as cognitive functions start to decline perhaps precipitously into dementia. Neuroplasticity is a mechanism that the brain will use to reassign functional processing from one area to the brain as it is damaged by trauma or disease.
One very good way to encourage the development of cognitive reserve and neuroplasticity is to practice nonlinear thinking methods that can help promote mindful solutions. Should the brain become damaged, it may be able to use nonlinear, symbolic visual thinking to cope, at least for a while. And while you practice you may also experience strength in your resolve and understanding.
Do note that the above comments are speculative. There is NO formal research on mind mapping or other comments about this in the literature (other than my own). Also, this is based only on my own experience and generalizations from my earlier research on daydreaming and imagery. So do not go about thinking that this proven. Rather it is speculative.
While I theorize that mind mapping is related to mindfulness in SOME applications, even if it turns out that it is not — from the results of formal empirical studies — there are other demonstrated benefits from mind mapping, so the actual use of mind mapping should still be encouraged.


 I consider John W. Tukey to be the King of Little Data. Give him a couple of colored pencils, the back of a used envelope, and some data and he could bring insight to what you were looking at by using graphic displays, eliminating “bad” data, weighting the findings, and providing charts that would allow you to explain what you were seeing to those who had never been trained in technical fields.
Tukey’s approach to “bad data” (outliers, miscodings, logical inconsistency) and downweighting data points which probably make little sense is what will save the Big Data Scientists from themselves by eliminating the likelihood that a few stupid datapoints (like those I enter into online survey databases when I want to screw them up to protect privacy) will strongly bias group findings. Medians are preferable to means most of the time; unit weighting is often to be preferred over seeing too much in the data and then using optimal (maximum likelihood, generalized least squares) data-fit weighting to further distort it.
Few remember that Tukey was also the King of Big Data. At the beginning of his career, Tukey developed a technique called the Fast Fourier Transform or FFT that permitted fairly slow computing equipment to extract key information from very complex analog data and then compress the information into a smaller digital form that would retain much of the information but not unnecessary detail. The ability to compress the data and then move it over a fairly primitive data transmission system (copper wires) made long distance telephone communications feasible. And later, the same method made cellular communications possible.
Hhmm. More than 50 years ago, Tukey pioneered the view that the way to use “sloppy” big data was to distill the necessary information from it in an imprecise but robust way rather than pretending the data were better because they were bigger and erroneously supported over-fitting statistical models.
Hopefully it will not take another 50 years for the Big Data folks to recognize that trillions of data points may hide the truth and that the solution is to pass out some red and blue pencils and used envelopes. Tukey knew that 50 years ago.
All it “costs” to adopt Tukey’s methods is a little commonsense.
Hhmm, maybe the Tukey approach is not so feasible. Big Data proponents at the current time seem to lack in aggregate the amount of commonsense necessary to implement Tukey’s methods.
Turn off the computers in third grade, pass out the pencils, and let’s teach the next generation not to worship Big Data and developing statistical models seemingly far more precise than the data.

The majority of the posts on this blog are about using visual thinking methods — of which I think that by far the best is #Buzan-style organic mind mapping — to understand, explain, evaluate, and communicate about healthcare. A lot of my own thinking has focused on using visual thinking techniques to potentially improve the quality of life of those with cognitive impairment and dementia.
Tony Buzan and Chris Griffiths and their colleagues and staff at ThinkBuzan have done a very comprehensive job at getting many of Buzan’s ideas embedded into a general purpose computer program (iMindMap) which provides a general visual thinking environment, of which mind mapping is a special part. There are many computer assisted mind mapping programs, but I have concluded that iMindMap is by far the best for creative visual thinking and communication, in no small part because it fully incorporates Buzan’s theory and theoretical implementation.
Like scientists and management consultants and educators and healthcare providers and patients and patient caregivers and students and many others, illustrators struggle with how to best use visual representations to support better thinking and communications.
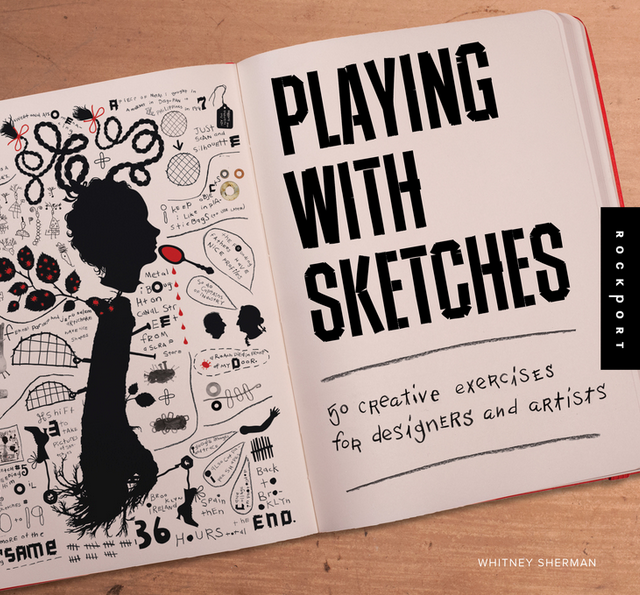
Which brings up this beautifully conceived and executed little book that I have found to be mind expanding and liberating in how to develop and use a series of illustration techniques and “tricks” to look at things differently when trying to make creative breakthroughs.
Whitney Sherman is the author of the book “Playing with Sketches” which provides 50 exercises which collectively will change the way you think about creating images to understand and communicate ideas.While Ms. Sherman wrote the book for designers and artists, the techniques will be just as useful for visual thinkers in science, education, medicine, industry, and other fields. The beauty of Ms Sherman’s exercises is that in showing you fairly simple ways to make hugely informative and well designed images, the tools will themselves suggest many applications to visual thinkers of all types.
And, I have found that Ms. Sherman’s techniques can be used by the severely artistically challenged (of which I am one); the techniques are ones for Visual THINKERS, not necessarily artists and designers.
I have mentioned this book before in much less detail, but in the months I have used the methods, I have found that they WORK very well to facilitate creative visual thinking. For me they have promoted a breakthrough in how I see the visual thinking canvas.
Get the book, try some of the techniques (pick a random one here and there to start), discover that great artistic talent or aptitude is not required, and see how the techniques fit the information you study in search for better healthcare or disease prevention or decision making or facilitating creative group processes.
In partnership with Tony Buzan’s techniques for organic #mindmapping and Mike Rohde’s framework for #sketchnoting, the techniques codified by Whitney Sherman provide very powerful visual thinking tools.
Ms. Sherman’s website is http://www.whitneysherman.com. She tweets at @Whitney_Sherman. The book is available from major online book sellers.
I will be posting some examples of using the sketching techniques of Ms. Sherman to developing assistance and communication techniques for those with cognitive impairment or early-mid stages of dementia.


Without accurate data it is all just mushed together by the analyst (or computer program of the week).

Sometimes the following trick helps me both code notes (or task lists) and grabs my attention when the ignored task list is floating around on my desk or becomes part of the wad of notes, receipts, and other small pieces of paper that accumulate in my pockets. I review the wad of paper regularly (hopefully finding it before I put the pants or shirt in the laundry and being transformed to lint in the dryer). This little trick is used by people who make sketchnotes for a living (see the wonderful books by Mike Rohde on sketchnoting). Sketchnoters — because of their business and professional audience — tend to use a more subtle and artistic version of what I do (after all their audience is wearing suits while my audience is me wearing shorts and an old T-shirt). Same principle though.

[Star Trek may have incorporated the following idea into some of its episodes.]


The thick-thin pens are called Fude de Mannen by their manufacturer Sailor and fairly inexpensive. A much more elegant and expensive option that does the same thing is any Sailor fountain pen with a Zoom nib. You can also do the same shift between thick and thin inexpensively with a Noodler’s flex pen or many calligraphy pens (the Japanese ones are best and brush pens work even better) or much more elegantly and expensively with either a Pilot Falcon pen or any Pilot pen equipped with an FA nib. I have no commercial relationship to any of these companies. The odds of finding any of these pens in a brick-and-mortar store in the USA are fairly low but they are available widely on the Internet with many coming directly from Japan (yup, they ship anywhere).
I use different writing implements to vary things, color code, and even slow myself down (like the decorative fonts do) in order to increase the time for memory encoding, to build in uniqueness that grabs attention, and to amuse myself (I am easy to amuse).
Many of these “tricks” are the same as those as used in mind mapping without the most important feature of structuring, restructuring, and formally associating many ideas.
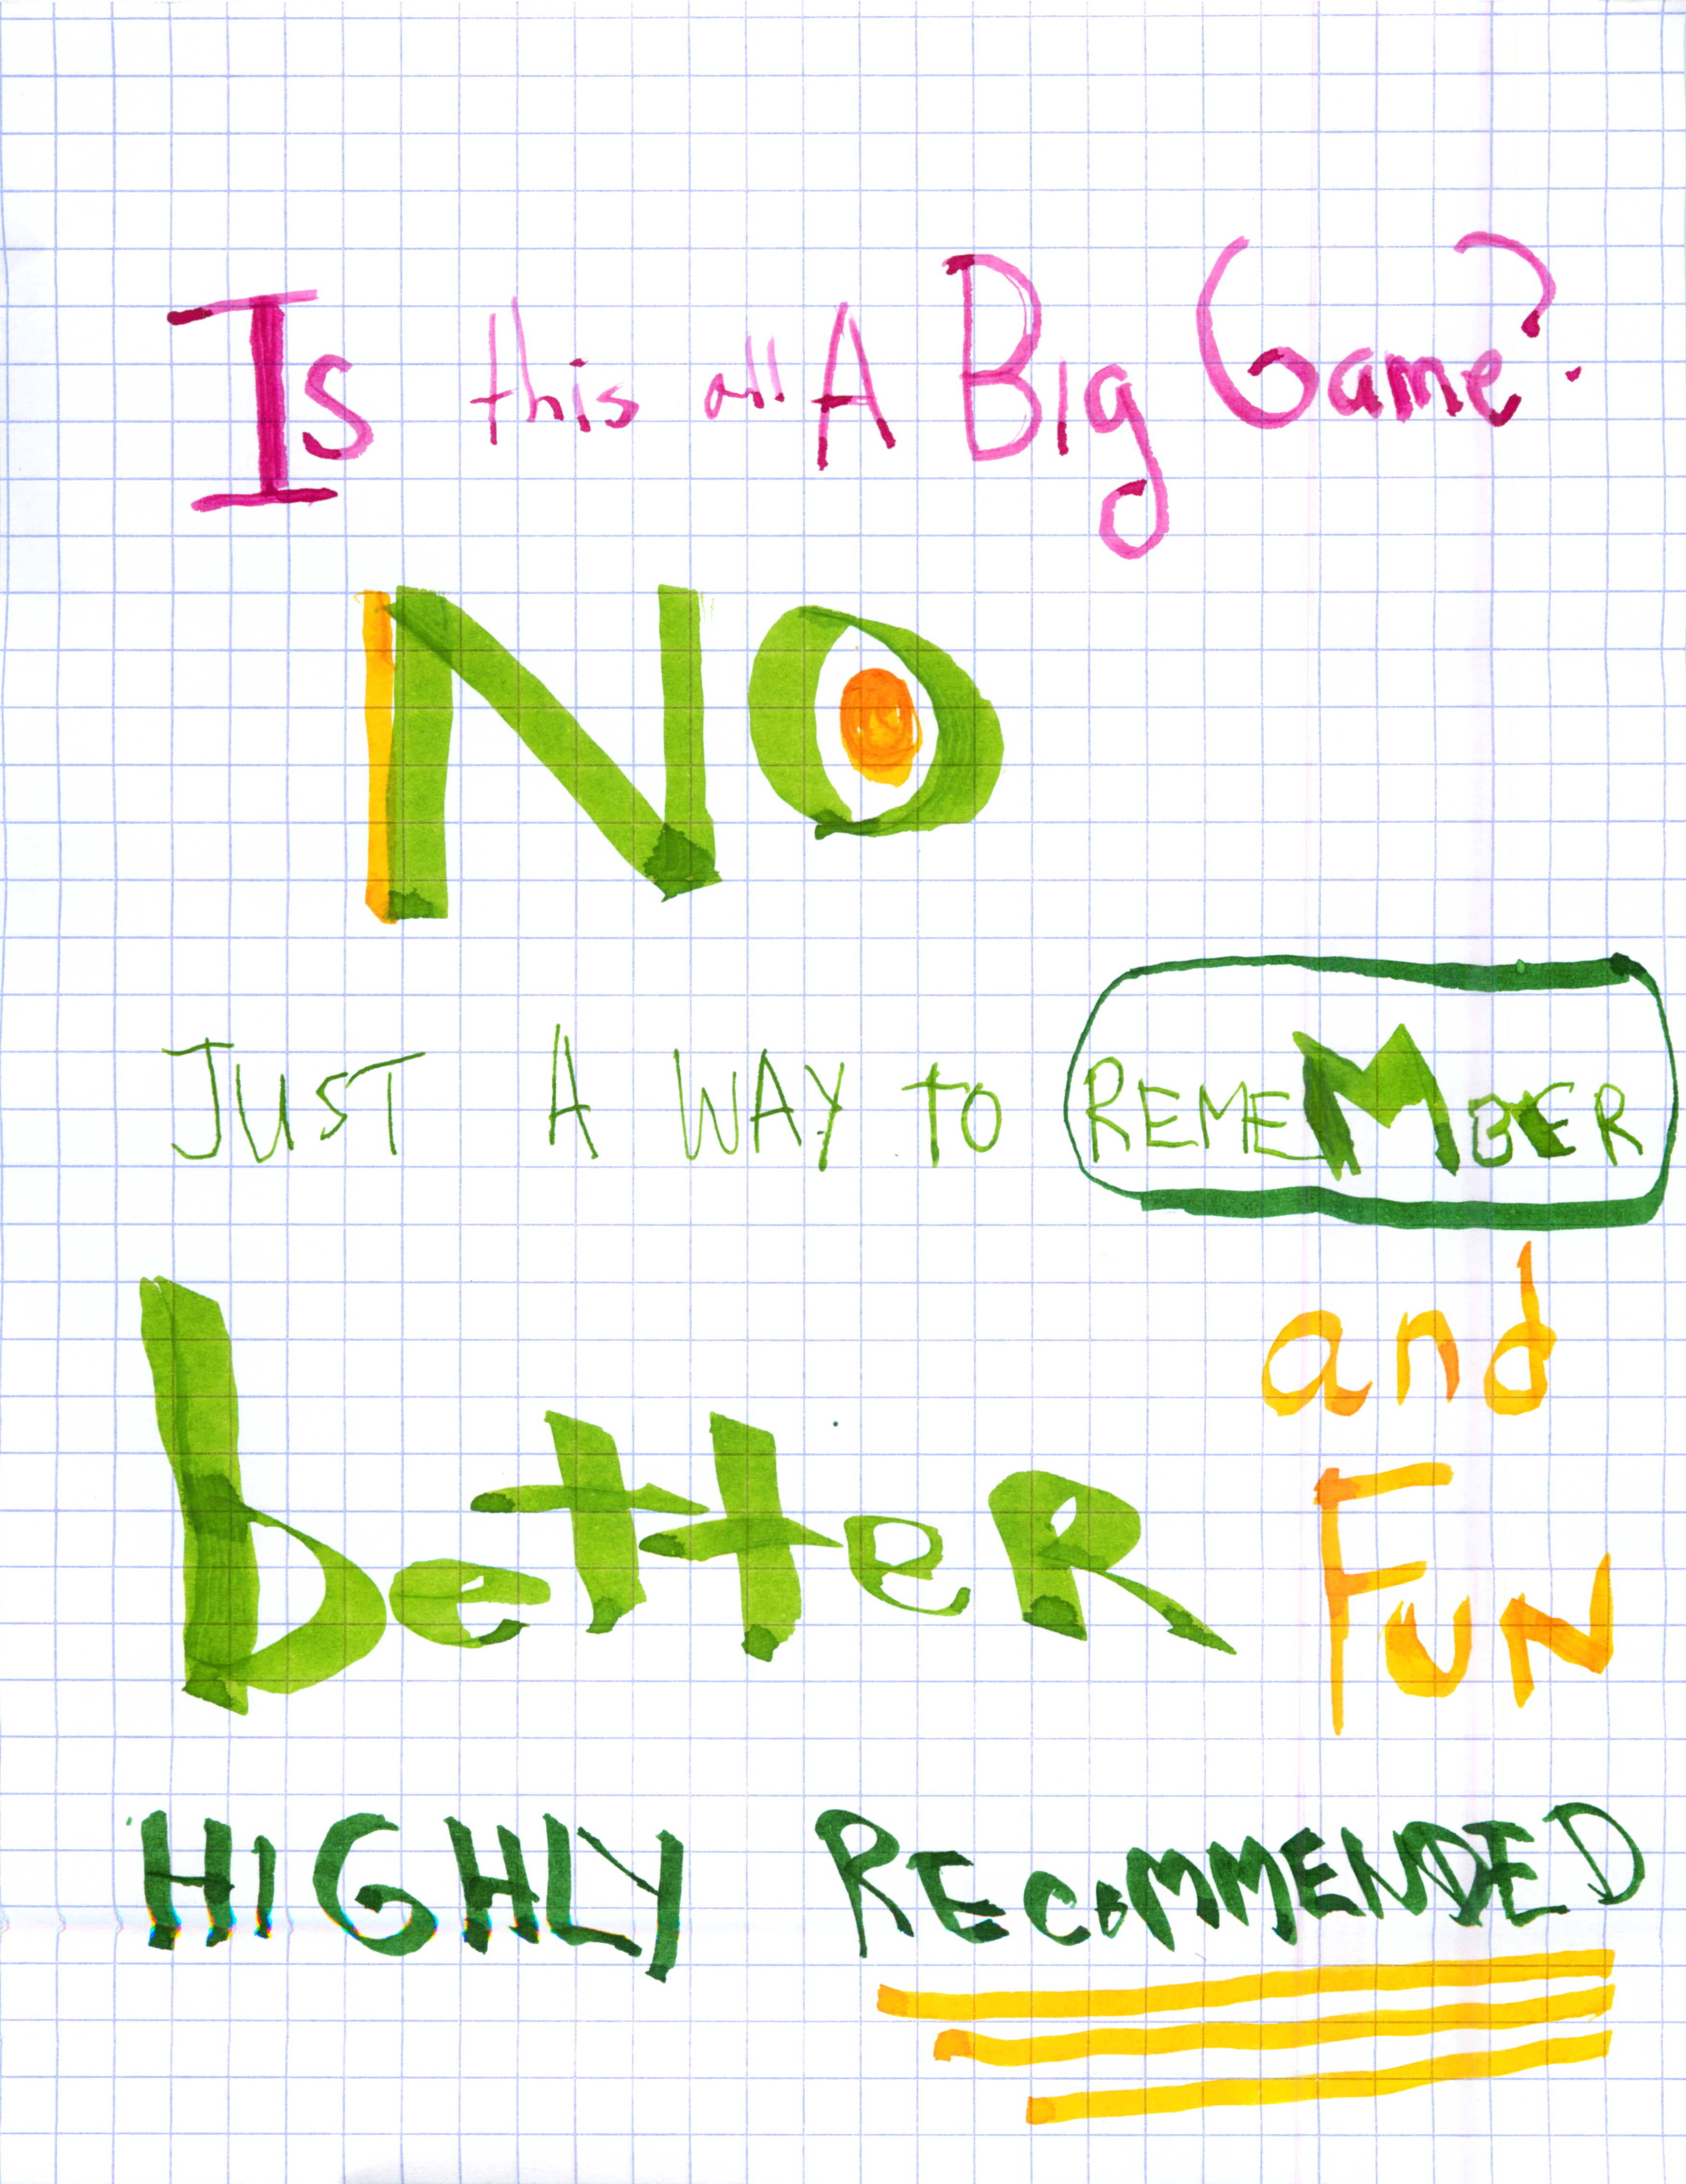
The next logical step after these kind of notes is mind mapping which I strongly endorse. On the other hand, some people just want to takes notes and may not want to take the time to carefully think through them or organize their thoughts, and for those folks at least remember this.
&&& the purpoSe of noteS is to REmemBER in parT because the noteS are MEMOR(Y)able and you pay more attention to them ***
While I cannot prove this, it is my guess that these techniques will also be useful for those with memory and attention problems like normal aging, cognitive impairment, dementia, Alzheimer’s, and ADHD. But all of these conjectures require empirical research to substantiate and are just WAGs (Wild Ass Guesses) on my part at this time.


Examples. Click any image to expand it.


This is my second post on the world-wide social brain. Click here to see the first post.
Click on the image to expand it.

Have any recent pictures of your family or cat or car or your vacation last summer? With the exception of the cat pictures I would love to see them. (I am a dog person, no cat pictures from me.)
A+

For researching, conceptualizing, evaluating, designing, and communicating I prefer to use a VIsual THinking ENvironment or #VITHEN.
There are three tools I use most on my Mac TOGETHER as a visual thinking environment. My preferred programs are iMindMap, Scapple, and Big Hairy Goal. I would rank them 1, 2.5, and 2.5 respectively.
Note that I do not use these three programs alone and on many project use iMindMap plus (Scapple or Big Hairy Goal). Combined these three programs provide an excellent VITHEN. If you only want to work with one program, use iMindMap, the premier and most comprehensive product in this space.
And, yes I coined the term VITHEN.
Click on image to expand.  #iMindMap, #Scapple, #BigHairyGoal, #VITHEN
Click image to expand.

Very simplified alternative to #Scapple. In most cases I would go with Scapple. The advantage here is that it is very easy to incorporate status and importance information into the diagram (by color and thickness of the box borders). This is an easy way to document the activities of the day. But then again, Scapple is also, and is far more flexible albeit more expensive.
Recommended but a stability improvement (bug fix) is needed.
Click image to expand.

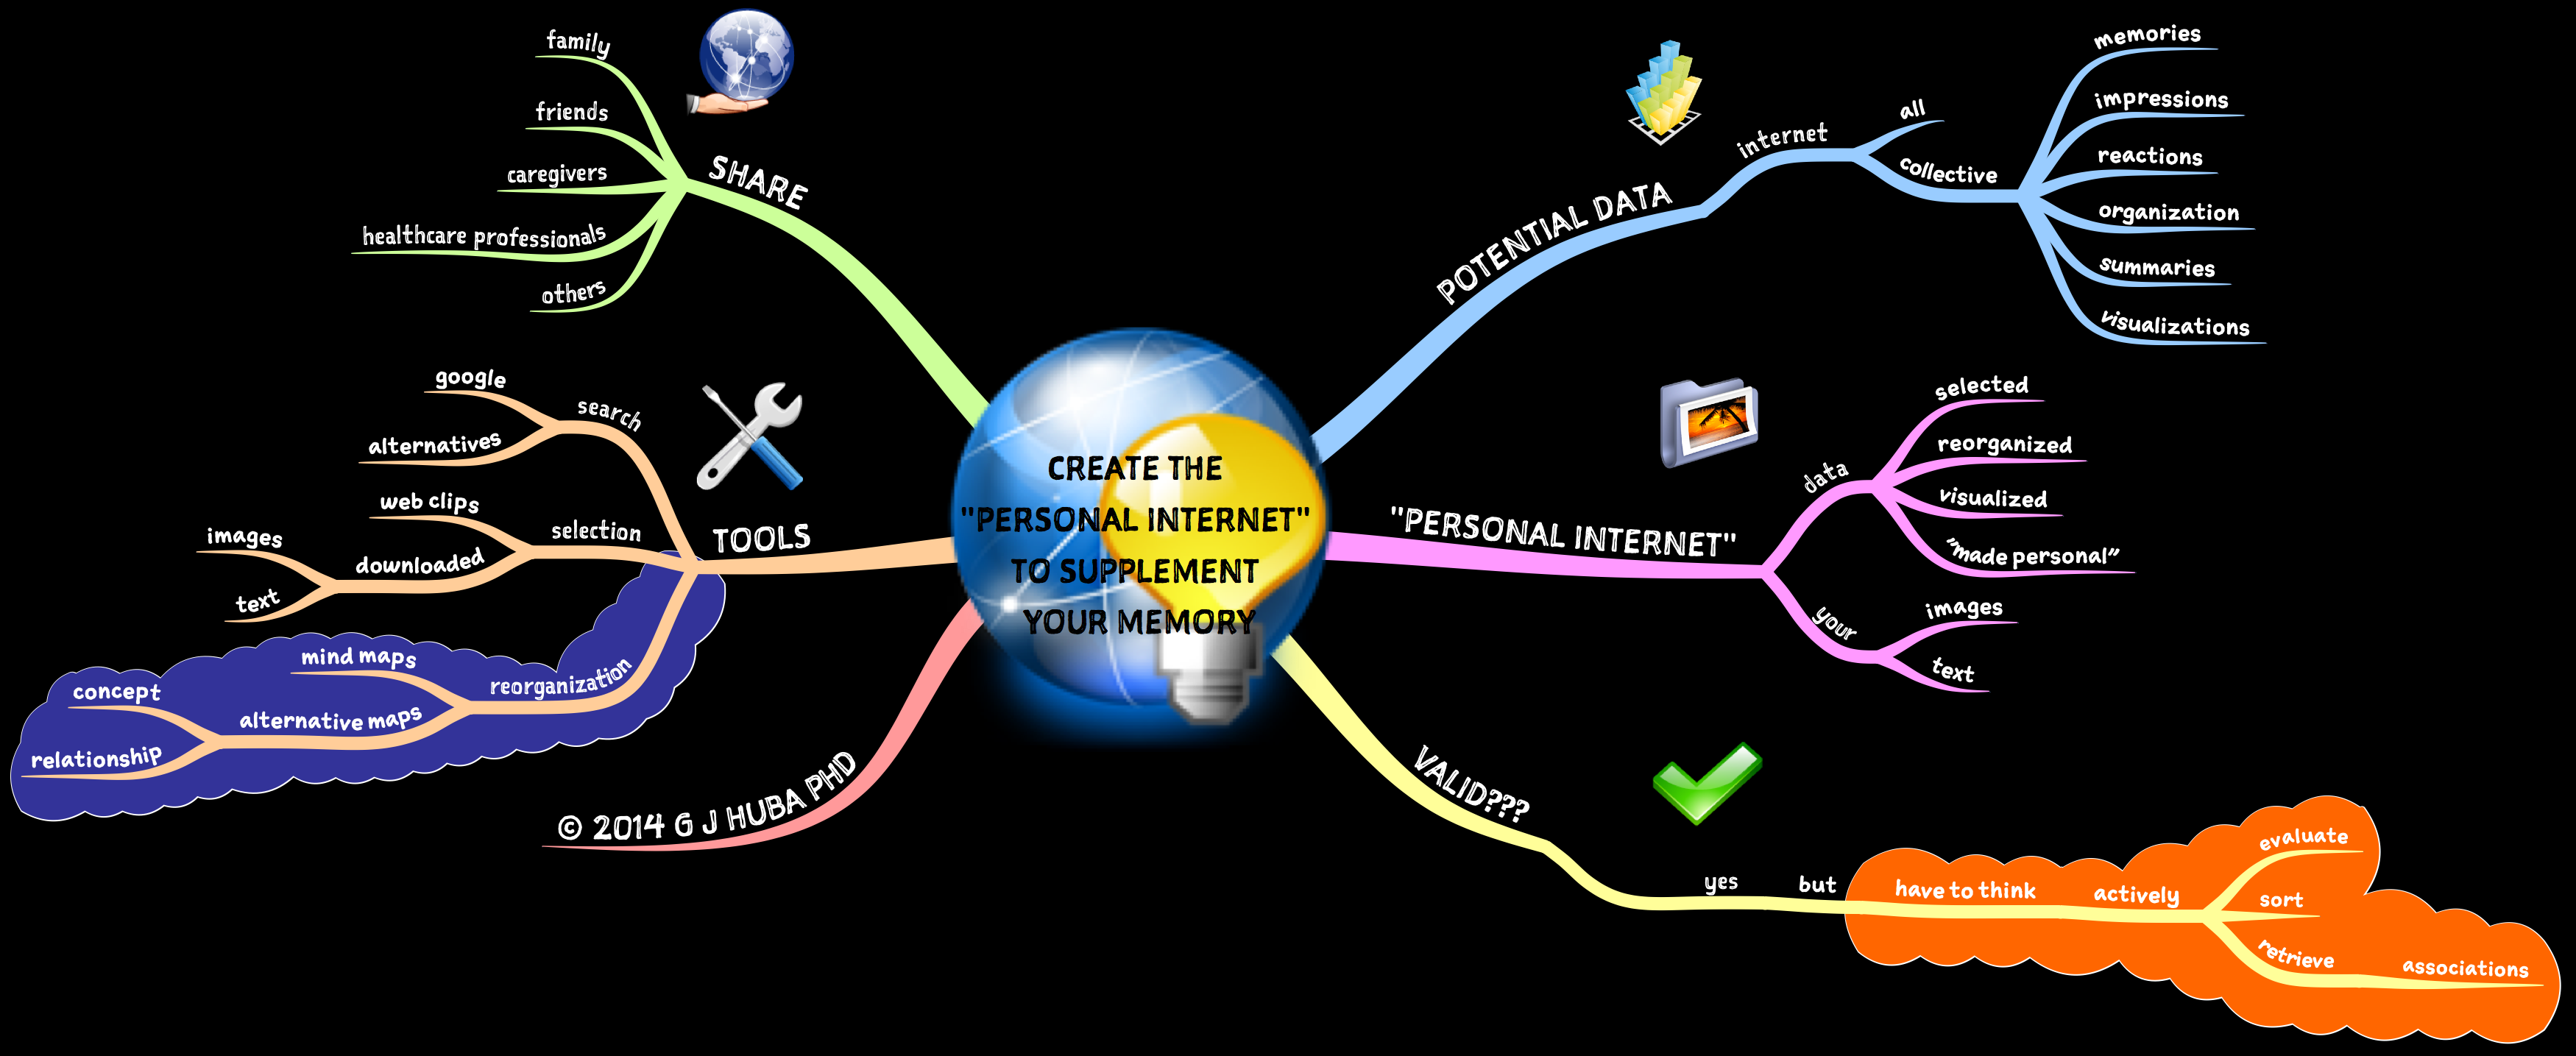
PART 1 discussed my view that a world wide memory is available to supplement an aging (and especially cognitively impaired) person’s biological personal memory (a.k.a. the brain).
Seems obvious, but is it?
I contend that even though Google and the huge information database contained on the Internet have been around for a while, it is only just now starting to be understood that this information can be “mined” and reorganized for individuals.
It’s not just about Facebook either although Facebook is an important part of it. As are all of the other social networks, the stuff for sale on the Internet, the old stuff on your computer, and the old stuff on the computers of your extended family.
It’s all about visualization, visual information processing, and rearranging that visual information for the individual. Like your Uncle Fred who is “losing it” or your Mom who has lost it or yourself. Or leaving behind visualizations for your kids and grandkids or your spouse (who even after decades will not know how you view all of the things that shaped you and are important).
In the spirit of visualization, lets go to a mind map for explaining visual thinking.
Please click to expand.
Or same map, slightly different format …

I’m getting old. Show me some pictures of Yankee Stadium two blocks from where I lived as an infant in 1951. Or remind me about those kids I knew in High School. Whatever ever happened to my office mate from grad school? Where could I get a copy of my college yearbook? The 1984 Olympics in Los Angeles were great (I went everyday for two weeks), how about some pictures? What does the home I grew up in look like now (apparently almost exactly like it did after my parents’ deaths, although the guy who bought it from us obviously does not know how to take care of shrub beds). Neighborhood looks almost identical, just the trees are bigger.
Don’t have photos or descriptions of some place or event you went to. The Internet does. Want to make sure the tales you have told for 30 years about freezing your ass off in Minnesota in ’76-77 were grounded in reality. Yup, the stat charts clearly indicate that was the case.
Look up something you seem to have forgotten. Browse information about events and places and you may find that you (with or without the help of the hyperlinks in Wikipedia) can remember even more things.
Are you a caregiver or healthcare provider for an individual with cognitive decline? It’s pretty easy to use the Internet as a big box of memories and pictures and even context to help the patient retrieve memories or relive parts of the past.
Given how I typically feel about the billionaire Darth Vader Juniors over at Google who trample individual privacy in the unending search for more liquid currencies, it’s going to be tough to say, but …
Just Google it.
Find out about your life or your parents’ or retrieve memories or recreate associations.
[Just remember that the world’s memory will also record what you just asked about so as to try to sell you yearbooks, genealogy services, or New York Yankee collectibles.]
Having a fairly accurate, very comprehensive collective world memory will potentially help many who are losing their own biological cognitive functions. It could very well help in caregiving and helping patients maintain or even increase their quality of life. Darth Vader Junior might even make it back from the Dark Side by providing funds and other resources to use the accumulated information of the Internet to help those with aging memory banks and CPUs.
Click on the image to expand it and see how these ideas go together. Form some new associations. The mind map in which the information is presented will help you do that.
Click here for Part 2 of this discussion.

Please click image to expand.

I use my Mac, and its software, primarily as an aid to thinking about everything from what to buy at the grocery store to how to develop large healthcare systems (after all, nobody working for Secretary Sebelius is doing any thinking so …).
I do not need a word processor or a spreadsheet or a statistical program. Rather I need a thinking environment, a writing environment, and a visualization environment. And a bunch of utilities to enhance the “big programs” that never come with all of the bells and whistles I need.
This is what I like for the computing needs I have. Remember … the computing needs I have.
If I only could choose four of these programs, in order these would be …
Click on images to expand.

or in 3D rendering …

The first version was published a few posts ago and created in iMindMap 6. The original post has a discussion of the highly credible web sites from which the information in the map was developed.

This second version was created by reformatting the first using some new tools available in iMindMap 7 and capitalizing on the improvements in speed and ease-of-use of tools that had been available in iMindMap 6, but in a more primitive way. In particular, it is now much easier to work with text meaning that pulling text into positions on the canvas ringing the map may be a good way to store data related to the conclusions embedded within the mind map.
As of last week, iMindMap 6.2 was the best mind mapping program available from any vendor. As of this week iMindMap 7.0 has blown 6.2 away, making a huge leap forward. The gap between iMindMap and the other mind mapping programs on the market has widened considerably.
iMindMap 7 is much more than a mind mapping program but rather a visual thinking/teaching tool and environment, within which mind maps are a large, but certainly not the only, component. In addition to the best mind maps available, the program can produce flow diagrams, path diagrams, concept maps, visual notes (like sketch notes), and combinations of all of the above.
iMindMap 7 is a visual thinking tool for a complete visual thinking environment. The app expands upon the mind mapping theory of Buzan and presents a much more elaborated environment for visual thinking and visual concept development than has been available before. And, just as importantly, to use apply this theory and use the tools of iMindMap 7 you need not be a “computer wizard,” “a professional mind mapper,” or a long time user of earlier programs and visual thinking theories.
I see the release of this program as the beginning of a period in which visual thinking and visual communication becomes even more important and used. Tony Buzan and Chris Griffiths have done a spectacular job in getting the theory and implementation so far along this path already. I hope they release a new book shortly.
Click the image below to expand and see my formal review. Note that I probably used less than 60 percent of the features of the program in the review map, and there is a lot more to explore in subsequent posts with differing types of information.

Oh, did I mention that iMindMap has a “presentation mode” which makes PowerPoint obsolete. Here is a video of the review above running in an automatic kiosk mode. There are a number of options for the presentations that can be applied depending upon the type of audience and the map content. And it can be presented in 3D which I chose to do. [For this example, a tiny file size with low resolution optimized for the web was used because the intent is simply to illustrate the feature, not crash the server. Note also that the low resolution does de-emphasize the 3D effect; 3D looks extremely good at HD resolutions. I also included a HD version which may give some servers trouble. Both presentations have the same content.] Click below to start the video (about 3 minutes).
low resolution
high resolution
If you don’t like the timing of the slides or the type of transition or the order, you can easily change these settings and reload the video.
[Footnote: I started programming mathematical algorithms in FORTRAN in 1970, published my first of several computer programs in peer-reviewed journals in 1973, and published an early mathematical algorithm and FORTRAN program in 1984 that was a precursor of what are now called concept maps (under the rubric in statistics of “path diagram” or “structural equations model”). Between 1977 and 1984 I published a large series of “visual mathematical models” of drug abuse etiologies and consequences using the LISREL programming environment. In comparison to all of my former experience with computer usage in real-world applications, this is the finest software application I have used in the 40+ years of my career. I am delighted I have the opportunity to use this app to explain some of my ideas and create new ones.]
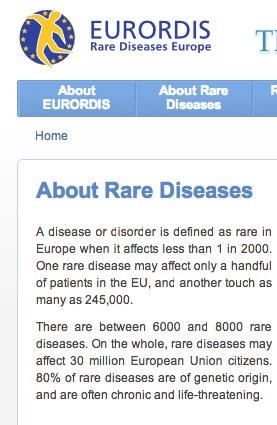
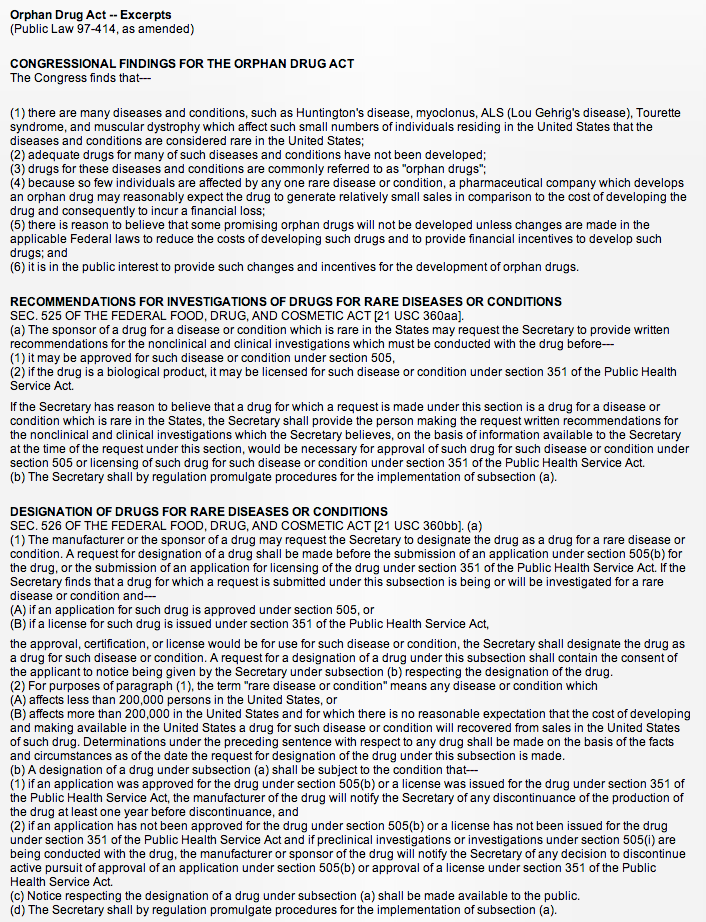
The only way I see to develop effective medical treatments and care models for many of the thousands of rare diseases is to pool the RESEARCH resources that individual countries are spending and the data countries are collecting about individual rare diseases and put those research resources under international control for prioritizing research agenda and ensuring public access to ALL results and research data.
Yes, I know the USA (probably the largest resource contributor) Congress will go in front of the television cameras and say that the failure of the United Nations and the disproportionate contributions to a pooled resource fund will ensure failure. They will point to the failure of the world to effectively coordinate collaborative research on HIV/AIDS and point to politics, homophobia, disrespect, and the hatred of American politics by certain national and fundamentalist groups and say we would be wasting our money by letting Africans and Arabs and the Russians and Chinese and Indians and Asians and South Americans collaborate with the USA on research and ensuring that research leads to effective treatments for at least some rare diseases.
Enough already. Let’s rise to the occasion of solving resource limitations in studying rare diseases and get an effective mechanism in place for expanding the impact of admittedly small research efforts by individual countries through international cooperation. I trust the governments of the world to collaborate, contribute as they can, and help us start to get some of these diseases treatable. Disease knows no boundaries.
In the last century we collectively developed very advanced medical research techniques. In this century we need to use these methods to solve all of the medical problems possible by putting aside the nonsense politics and nationalism and individual egos and predatory profits and focus on solving many medical issues and ensuring access to effective treatment world wide.
Here’s a way to start. Any yes, this is a test of our humanity and commitment to universal human rights of which medical treatment is but one. But let’s start somewhere that should be relatively easy to agree on (and let a few hundred angry politicians in the USA know that the world considers them bratty children and cannot tolerate their obstructionist and oppositional behavior).
Click on the image to expand. And let’s start the process of collaboration.

Mind mapping is a wonderful tool. Many use it to inform others of important facts and make sure those facts are remembered, understood within context, associated as appropriate with other knowledge, communicated well, and result in learning. I endorse the successful use of mind mapping.
Mind mapping is a wonderful tool for informing.
Mind mapping is a wonderful tool for misinforming.
Think about this. If the method makes the learning of “good” information faster and more accurate, it does the same thing for “bad” information, idea garbage, or propaganda.
You need good information to map. You know, the kind that is scientifically proven, well interpreted, important, replicable, unbiased. You know what I mean. (The kind of good information that would never make it onto the Fox Cable network.)
So it is really simple. Show me the source of the information and what evidence supports it. I will decide if it is a diamond or zirconium. Nourishing or poison. Message from heaven or hell. Mac or PC.
Do not tell me you have a map of some important psychological issue when you do not have a single citation to replicable science, or at least well-accepted theory, anywhere in the map or the accompanying text.
The problem of presenting bad information and helping others learn it well is probably the most important when the content is derived from medicine, healthcare, psychology, or education. Personally I care less if a business person hires the wrong management consultant and buys the Brooklyn Bridge, but that is a matter of personal preference and I still would not like to see shareholders hurt. You want to teach it in a way that improves the chances that it is learned? Make sure it is true.
A mind map is a METHOD. The mind map should be used as a METHOD to accurately report correct, important information. A mind map may make information look more valid or important than it is, so the author of the map has to be responsible fully researching the information to be presented BEFORE MAPPING. To map information that you do not fully understand is doing a disservice both to the reader and to your reputation.
Click on the image (twice) to fully expand.

As is said (albeit in a quite different context) “use it or lose it.”
You age and people tell you to start doing crossword puzzles (I’ve never liked them) or to do simple arithmetic on an iPad (hhmmm… I prefer advanced mathematics) or to get your pictures together in a box (I prefer slide shows from a high-end photo processing app).
Use it or lose it.
Why start doing baby mental exercises as you get older? Why not use a better way of organizing information, planning, making decisions, and actively thinking about things around you, your life, or advancing a new intellectual hobby (mine are visual thinking research and great mandolin and ukulele players of the world)?
Use it or lose it.
Many people look at mind maps and think they are pretty pictures or formatted outlines. In fact many so-called “mind mappers” pass off work that is not mind mapping as mind mapping.
One of the most frequently ignored or missed parts of Tony Buzan’s seminal writings on mind mapping is that mind mapping requires active thinking. It is not a passive process of formatting an outline of the same-old, same-old, same-old information.
Mind mapping is really a combination of using the pretty tools in mind mapping programs to facilitate active thinking about something and to develop actively a summary model of how all the thoughts go together.
Do you think active learning through mind mapping is a better way of thinking that for many older adults is new and novel and might be a way to “use it and not lose it?”
I think so. Use it and don’t lose it.
An example. Click on image to expand.

*********
Also see, “Running Away to the Circus”
Also see “Cognitive and Behavioral Tools for Dealing with Cognitive Decline: A #MindMap”
Sending out a graphic and colorful SIMPLE visual agenda by email really helps a conference call move along and keep the big picture in sight.
Keeping the map simple allows individual participants to take their notes by making additional (sub-)branches. Try it. Works!
[People spend less time on their end of the speaker phones reading email and cleaning their desks and more time actually thinking creatively.]
An example. Click image to expand.

I have been advocating for visual thinking, visual communication, and visual collaboration through mind mapping on this blog for several years.
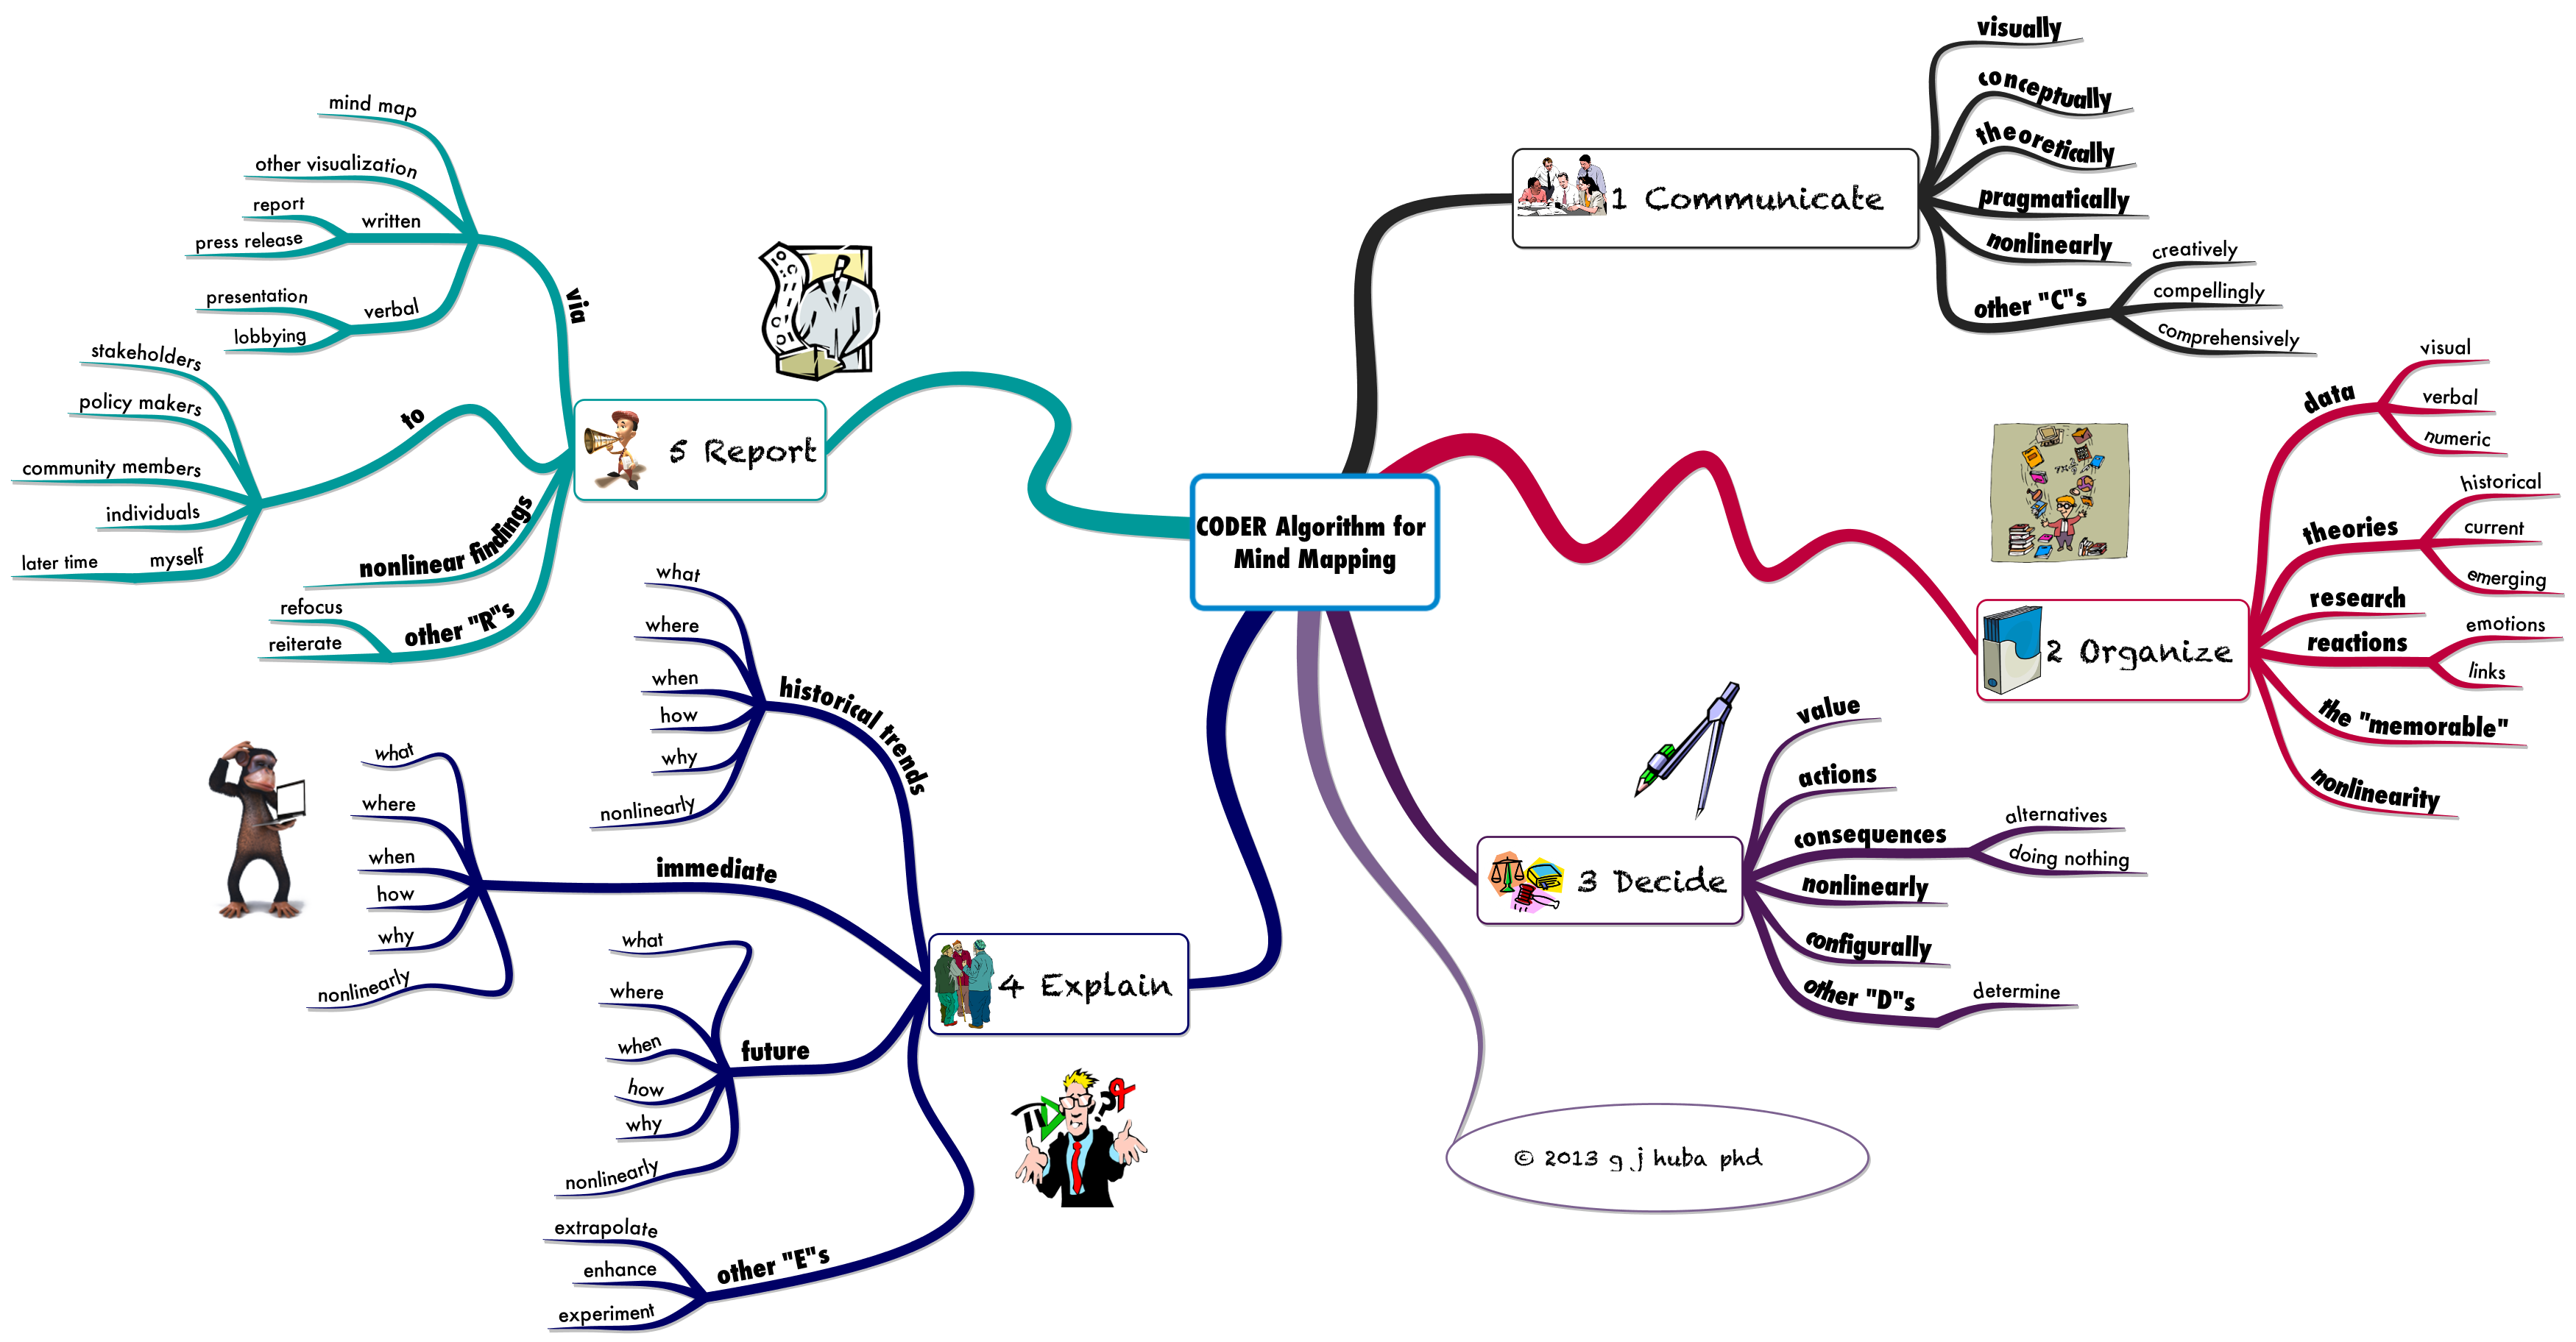
I would summarize my experience using mind mapping to move to a more visual and nonlinear and successive approximation thinking style as the #CODER Model.
Here it is. Click on the image to expand it.
I like to tell random stories under the assumption that at the end the lessons can all be tied together (after all I am telling all of the stories).
Here is a summary in visual form which is mainly how I think these days ..

reformatted June 2014 in iMindMap 7.1

Annually I used to give a presentation to graduate students in clinical psychology (the “I hate data, I hate statistics” crowd) at a famous psychology professional school about how to research and write a doctoral dissertation. The number one question everyone had was (nnoooo, not how to do good research or how to pick an important topic) how long it takes to write a doctoral dissertation. All of the dissertation advisors in the room with their students would wince and make rude sounds. I would respond “I know the exact answer and it is 1200 hours (30 hours a week for 40 weeks).” And the students would all have relieved smiles. Then I would say, “but you cannot count the hours you spend kvetching, bitching, whining, going out for coffee with your friends, or on the phone talking about your dissertation blues.” (This was in the days before Twitter and Facebook or I would have included those too.) I think this applies to all writing and other creative work; the “kvetch factor” determines how successful you are. Control kvetching and it is pretty easy.
People in most work situations often waste a lot of time going out for coffee and kvetching. In the company I owned, I purchased an $1800 “grind and freshly brew every cup of coffee machine,” unlimited bags of gourmet coffee, expensive tea bags, a small refrigerator stocked with every kind of soda available, a designer water cooler, a microwave oven, unlimited popcorn to nuke, and fresh fruit on occasion when somebody complained that all theew was to eat was popcorn. All were available at no cost to the employees. The designer coffee machine paid for itself in a few weeks. Happier folks, more conversations among employees (good, they eventually lead to collaboration and creativity), more team building, more cross-fertilization of ideas and skills. Of course, you could still go out to Starbucks if you wanted to. Almost nobody did since we had all the Starbuck’s coffee you could drink in the office for free (the machine also made expresso, lattes, and all of the other trendy coffee drinks). Visiting clients liked the break room a lot too.
When employees, collaborators, clients, and others would call, email, or show up unannounced at my office door in a state of high agitation, anxiety, or general “lost in spaceness,” I found that reminding them that we were just social scientists and were not “building a nuclear weapon” almost immediately relieved tension and worry. Sadly, some folks are building and using weapons of mass destruction this week.
In the past 30 years, folks have always talked about innovation and creativity as coming from software and hardware. I always found that real advances come from people-ware (which initially surprised a hi-tech guy like me). Social media is good, telephone calls are better, face-to-face meetings of stakeholders are best. And lots of time needs to be provided for a nonlinear process to occur, re-occur, and grow. Instead of teaching students and new employees how to better avoid people with technology reducing interactions and directives by email never checked to make sure it WAS actually received, we should be teaching them how to work effectively with other creative people by actually sitting down together and hammering out differences and developing new strategies for cooperation. It’s so retro 1960s that it could be the next trend.
Most people work hard to develop products that are so new and fancy that they are “bleeding edge” or so advanced they scary ordinary people. In our company, I never sought to be at the bleeding edge. Rather, any time new bleeding edge methods were developed, I would immediately try to develop the “12 months after the bleeding edge” products that people could use now and understand because of my explicit assumption that there is not an awful lot of use for methods that nobody can use! There is a lot of use for methods that somebody with a reputable track record had simplified (but NOT dumbed-down) and explained. Being at the bleeding edge often means your fingers get cut; simplification and training make the use of the tool a way to discover and communicate.
Office toys are a great thing. Over the years in my company we had a huge blow up clown you could kick when everything was not going perfectly (expressing verbally what had gone wrong and encouraging those within ear shot to suggest solutions). Games (the weekly contest on how many blue m&ms were in the packages being taken from the company chocolate stash; yes we had free chocolate some days, too) helped build communication. There was a talking and rockin’ parrot toy in my office often turned on during meetings.
We weren’t developing thermonuclear devices by email; we were counting and enjoying blue m&ms.


