Without accurate data it is all just mushed together by the analyst (or computer program of the week).

social, health, political imagery through the lens of G J Huba PhD © 2012-2021
Without accurate data it is all just mushed together by the analyst (or computer program of the week).
Remember the “gold standard” research paradigm for determining if a medical treatment works: the DOUBLE BLIND, RANDOM ASSIGNMENT EXPERIMENT?
The design has historically been considered the best way to “prove” that new medical interventions work, especially if the experiment is replicated a number of times by different research teams. By the double blind (neither the treating medical team nor the patient know whether the patient is taking a placebo or active medication) design, investigators expect to negate the placebo effects caused by patient or medical staff beliefs that the “blue pill” is working.
A key part of virtually all double-blind research designs is the assumption that all patient expectations and reports are independent. This assumption is made because of the statistical requirements necessary to determine whether a drug has had a “significantly larger effect” as compared to a placebo. Making this assumption has been a “standard research design” feature since long before I was born more than 60 years ago.
2013
Google the name of a new drug in clinical trials. You will find many (hundreds, thousands) of posts on blogs, bulletin boards for people with the conditions being treated with the experimental drug, and social media, especially Twitter and Facebook. Early in most clinical trials participants start to post and question one another about their presumed active treatment or placebo status and whether those who guess they are in the experimental condition think the drug is working or not. Since the treatments are of interest to many people world-wide who are not being treated with effective pharmaceuticals, the interest is much greater than just among those in the study.
Google the name of a new drug being suggested for the treatment of a rare or orphan disease that has had no effective treatments to date and you will find this phenomenon particularly prevalent for both patients and caregivers. Hope springs eternal (which it SHOULD) but it also can effect the research design. Obviously data that are “self reported” from patient or caregiver questionnaires can be affected by Internet “the guy in Wyoming says” or the caregiver of “the woman in Florida.”
OK you say, but medical laboratory tests and clinical observations will not be affected because these indices cannot be changed by patient belief they are in the experimental or placebo conditions. Hhmmm, Sam in Seattle just posted that he thinks that he in the experimental condition and that his “saved my life” treatment works especially well if you walk 90 minutes a day or take a specific diet supplement or have a berry-and-cream diet. Mary in Maine blogs the observation that her treatment is not working so she must be in the placebo condition and becomes very depressed and subsequently makes a lot of changes in her lifestyle, often forgetting to take the other medications she reported using daily before the placebo or experimental assignment was made.
Do we have research designs for the amount of research participant visible (blogs, tweets, bulletin boards) and invisible (email, phone) communication going on during a clinical trial? No. Does this communication make a difference in what the statistical tests of efficacy will report? Probably. And can we ever track the invisible communications going on by email? Note that patients who do not wish to disclose their medical status will be more likely to use “private” email than the public blog and bulletin board methods.
Want an example. Google davunetide. This was supposed to be a miracle drug for the very rare neurodegenerative condition PSP. The company (Allon) that developed the drug received huge tax incentives in the USA to potentially market an effective drug for a neglected condition. The company, of course, was well aware that after getting huge tax incentives to develop the pharmaceutical, if the drug were to prove effective in reducing cognitive problems (as was thought), it would then be used with the much more common (and lucrative from the standpoint of Big Pharma) neurodegenerative disorders (Alzheimer’s, Parkinson’s) and schizophrenia.
Patients scrambled to get into the trial because an experimental medication was better than no medication (as was assumed, although not necessarily true) and the odds were 50/50 of getting the active pills.
Patients and caregivers communicated for more than a year, with the conversations involving patients from around the world. In my opinion, the communications probably increased the placebo effect, although I have no data nor statistical tests of “prove” this and it is pure conjecture on my part.
The trial failed miserably. Interestingly, within a few weeks after announcing the results, the senior investigators who developed and tested the treatment had left the employ of Allon. Immediately after the release of the results, clinical trial participants (the caregivers more than the patients) started trading stories on the Internet.
Time for getting our thinking hats on. I worked on methodological problems like this for 30+ years, and I have no solution, nor do I think this problem is going to be solved by any individual. Teams of #medical, #behavioral, #communication, and #statistical professionals need to be formed if we want to be able to accurately assess the effects of a new medication.
Click on the image to expand.

Divvy is a wonderful free data visualizer program for the Mac. The program permits a number of data reductions using highly informative transformations, cluster analysis, and plots.
Indispensable for exploring data. Free. VERY fast.
Click on images to expand.
Click here to go to the Divvy web site.


Calca is a must have app if you ever have an occasion to combine numbers and text together. The app combines a terrific, very flexible, very comprehensive, and very easy-to-learn-and-use calculator with a very good markdown editor.
Here is my review clipped as a screen shot from Calca for the Mac. Note that versions are also available for the iPad and iPhone. The screen shot is followed by a review in the form of a mind map.
Click on images to expand.


a HubaMap™ by g j huba phd
This afternoon I went to the local Panera and paid by credit card. My bank declined my charge of $4.82. I figured it was the magnetic strip on the card which had failed or that the new trainee using the cash register may have made a mistake. She ran the card three more times and it was rejected. Then I got four text messages from the bank saying that they are rejected my charges. To text me, they used my phone number.
I called. They had put a hold on my card because they had some questions about my charges from the prior few days. The red flag event was that I had made an earlier charge of $9.65 at Panera about eight hours before. Their computer program was not smart enough to figure out that it was not unreasonable for someone to have breakfast at 6:30am at a Panera in Durham and then walk into a Panera in Chapel Hill later in the day with 30 minutes to kill and had a coffee (and a Danish I probably should not have had) while I played with my iPad on their free wireless connection. The computer also questioned the $1 charge at a gas station this afternoon (which the human representative immediately recognized as the established practice of gas stations opening charge lines with their automated payment systems of $1 when you swipe your card and then next day putting a $92 charge on the card for filling the tank). I was also asked if the payment made on the account was one I had made (I asked the customer service rep if she thought that if someone had paid a bill for me that I would tell her it was an erroneous transaction and she laughed for a long time) as well as a $71 charge to a software company outside the US.
They had freaked out because they could not reach me by phone at three numbers that were old ones not active (I know they have my current number because they sent me texts at it and same bank sometimes calls about my other accounts at the cell phone I never turn off and which has a voice mailbox). Of course, if they did not have a no reply text address, I could have responded to the four texts they sent.
Predictive models have been around for a decade or more in banks as they attempt to identify fraud and protect themselves. The episodes I have with my bank about every 2-3 months illustrate what happens when somebody blindly runs predictive analytic programs through big datasets without using some commonsense to guide the modeling process. Just because anyone can buy a $100,000 program from IBM or others for developing predictive analytics does not mean that the model that comes out of the Big Data and expensive program makes any sense at all.
Or that the NSA or FBI or CIA or Google or Amazon models make much sense as they probe your private information.
If a computer predictive system is going to think that somebody is committing credit card fraud because they purchase two cups of coffee at the same national restaurant chain in a day, we are in big trouble.
The bottom line is that Big Data models are going to have to be regulated before some idiot accidentally turns on Sky Net.
Or maybe the problem is that the NSA or FBI or CIA or Google has done it already.
Structural equation models, popularized by Joreskog and Sorbom within their LISREL computer program that solved long-standing mathematical estimation issues, have been recognized by many as the most powerful (or one of few most powerful) statistical model(s) available within the social and health sciences. A combination of concept mapping and mind mapping can quite effectively be used as a direct visual (or theoretical) analog of complex mathematical structural equation models. Such maps can be a good way of communicating the results of the structural equation modeling or in developing the theoretical models that will be tested. And yes, you can test the fit (appropriateness) of the models (diagrams) in a statistically rigorous way.
Yup, you heard here first (although path-like or combined mind map/concept models have been around for at least 45 years and I published hundreds of these in the late 70s though the 1990s in peer-reviewed social science and methodology journals and others simultaneously and subsequently have done the same). I am going to blog a LOT on this in the next few months. Mind and concept maps can be directly and formally simultaneously assessed if there are appropriate data available. Of course, such data are hard to come by, but not as hard as many believe.
The best way to draw concurrent concept and mind maps models is #iMindMap (using the flow chart option along with a mind map for a hybrid model). In structural equation modeling, a mind map would represent the estimation of measurement model parameters while the concurrent concept map would represent the structural model.
Mind Maps + Concept Maps can be statistically and concurrently estimated from appropriate data by Structural Equation Models.
Really.
Needs a lot of data, though. Current Macs and PCs are finally fast enough to do the statistical calculations in a notebook computer.
This is Mind Mapping 3.0 at its very best.
Much more on this topic is coming including a lot of demonstrations that mind maps and concept maps can be easily developed as a consequence of very rigorous mathematical model. And tested for goodness-of-fit.
[aaaahhh what the hell … While I am tempted to add a lot of equations, numerical analysis, and map pictures to this post, I will not do so and not mix up the media and message. This is the pilot. The series is coming this summer.]
The following generic sample illustrates what the hybrid models look like.
Constructs are measured by indicators. Indicators are usually imperfect and can be corrected in the statistical modeling. The relationship between constructs and indicators is shown in the mind map.
The constructs themselves may be related in a causal or noncausal way. The concept map shows the relationships that are present as determined by the statistical modeling.
Click on image to increase size.


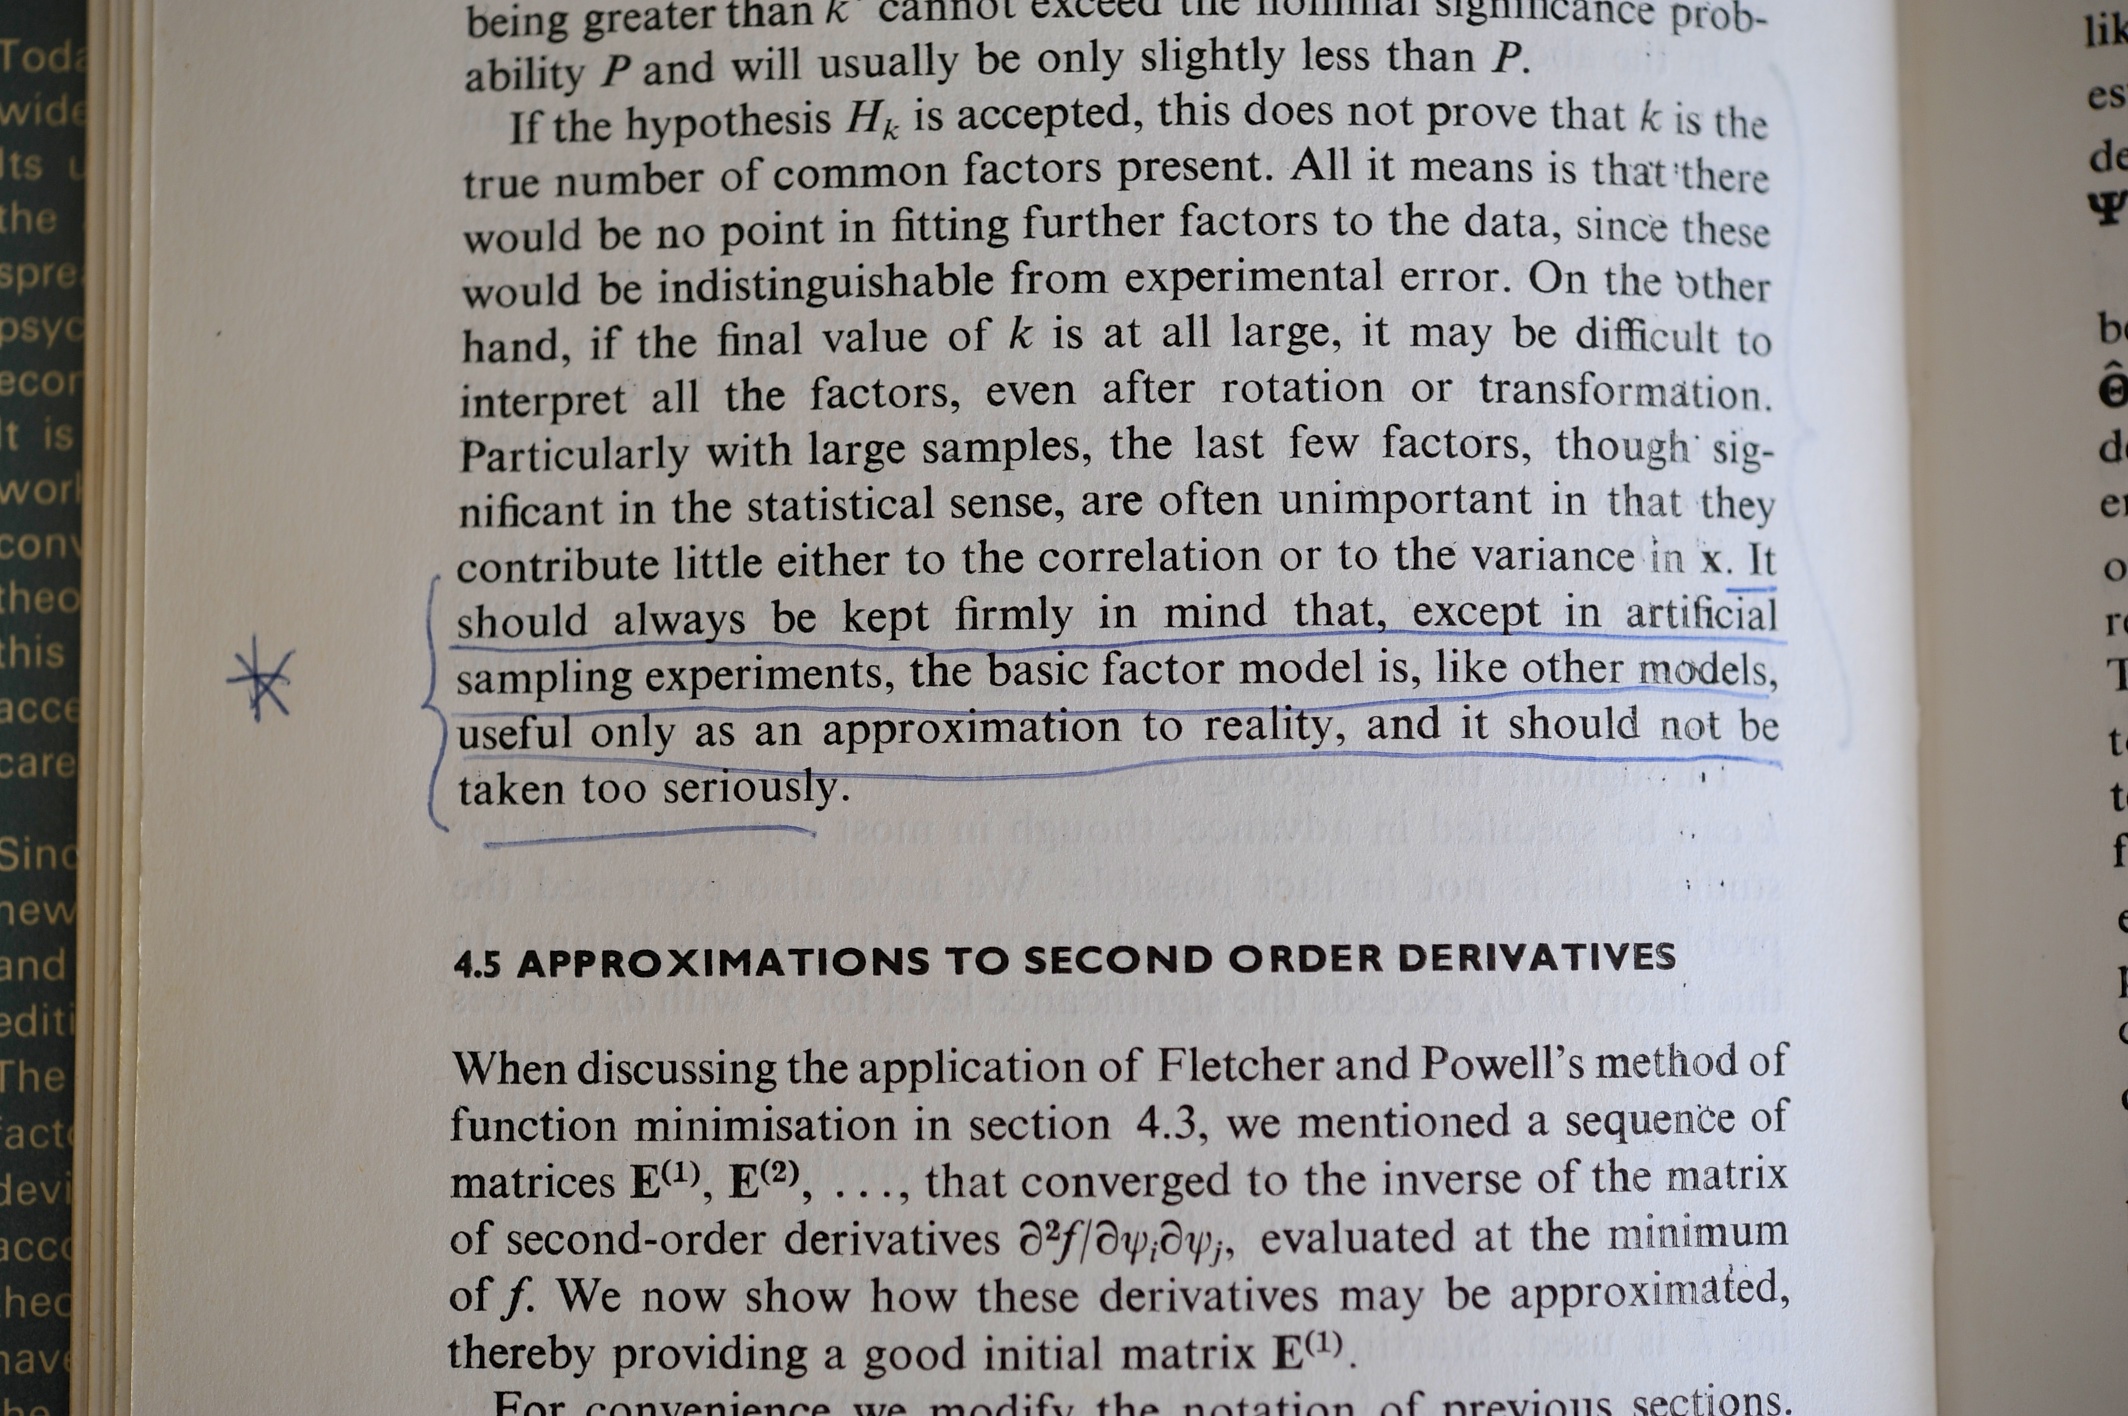
Lawley and Maxwell’s book on factor analysis legitimized the psychometric development of factor analysis as a “real” statistical model. Although most now praise them for their breakthrough in deriving maximum likelihood estimators for the model parameters, I think the following sequence of photos shows Lawley and Maxwell’s great insight and most important contribution, received at the time as general heresy by the high priests of factor analysis.
I read this book around 1975. The paragraph I underlined and typed on the cover is one that significantly altered my career: I learned then, and further in the early 1980s, that statistical theories of psychological processes, at their very best, are only weak approximations to reality. At the time lots of psychometricians were giving their professional lives to determine if one blindly empirical factor rotation method was better than another since after all they were different by 3 percent and everyone had just “discovered” Joreskog and Sorbom’s work on structural equation modeling. I never spent more than 50 percent of my research time between 1977 and 1984 on psychometrics and statistics — the rest of the time went into modeling adolescent drug abuse behaviors and their precursors. In 1984 it was time to move on to 90 percent of my work being devoted to real psychological and social issues.
As for statistical-psychology theories, the fact that
does not sway me anymore.
Please click on the pictures to zoom.

NOT

Click on mind map to expand.


Please click on the graphics to zoom.


I have been writing (and mind mapping) a lot recently about the need to make sure that mind maps purported to contain “expert” information are valid, reliable, important, and data-driven. I have noted that I also think these mind maps are better communication devices if they are “organic” (in the sense of Tony Buzan) and “artistic” and creative. And I am fairly sure that valid and memorable organic mind maps can be much better for encoding information into memory.
The best example I have found of a profesional who consistently produces valid, reliable, important, data-driven, organic, artistic mind maps is Hans Buskes who posts his work frequently on his blog mastermindmaps and tweets as @hansbuskes. Dr Buskes’ maps have well-researched information that meets current standards of excellence, are easy to understand, and data-driven. Look at his two English-language e-books on mind mapping. The book available on iTunes is offered for free.
I view the work of Dr Buskes as the standard I hope to achieve.
The examples are partial screen clips of two of Hans Buskes’ maps. See the mastermindmaps blog site for the full maps and explanatory materials.

Write the equation on the screen, the app uses handwriting recognition to translate it, and up pops the answer.
The following examples were all generated on an iPhone 5. The diagrams are the output from the calculation (easily stored as photographs or emailed). Landscape orientation is much easier to use than portrait orientation.

The following figures show is a sequence of calculations. The equation is altered by adding extra calculations to the equation.


Cool. Fast. And big attention getter in a meeting. You too can be the coolest nerd.
BIG Data is coming (or has already come) to healthcare. [It is supposed to usher in new eras of research, economic responsibility, quality and access to healthcare, and better patient outcomes, but that is a subject for another post because it is putting the carriage before the horse to discuss it here.]
What is a data scientist? A new form of bug, a content expert who also knows data issues, an active researcher, someone trained in data analysis and statistics, someone who is acutely aware of relevant laws and ethical concerns in mining health data, a blind empiricist?
This is a tough one because it also touches on how many $$$$$ (€€€€€. ¥¥¥¥¥ , £££££, ﷼﷼﷼﷼﷼, ₩₩₩₩₩, ₱₱₱₱₱) individuals and corporations can make off the carcass of a dying healthcare system.
Never one to back away from a big issue and in search of those who value good healthcare for all over the almighty $ € ¥ £ ₨ ﷼ ₩ ₱, here are some of my thoughts on this issue.
Click image to zoom.

Content knowledge by a well-trained, ethical individual who respects privacy concerns is Queen. Now and forever.

topics and subtopics: who is a “health” data scientist? trained in healthcare? methodology research databases management information systems psychology? psychometrics other public health? epidemiology other medicine? nursing? social work? education? biostatistics? medical informatics? applied mathematics? engineering? theoretical mathematics? theoretical-academic statistics? information technology? computer science? other? conclusions must know content 70% methods 30% must honor ethics 100% laws practice privacy criminal civil federal state other greatest concerns correctness of results conclusions ethical standards meaningfulness validity reliability privacy utility expert in content field data analysis data systems ethics and privacy other member? association with ethics standards licensed? physician nurse psychologist social worker other regulated? federal hipaa state other insured? professional liability errors and omissions continuing education requirements? ethics renewal of licensure regulatory standards insurer commonsense laws go away if not well trained content field data analysis not statistics committed clean data meaningfulness subject privacy peer review openness ethics ethics ethics are arrogant narrow-minded purely commercial primarily motivated $$$$$ blind number cruncher atheoretical © 2013 g j huba
I wouldn’t go on a bus trip with a driver who is unlicensed. Would you?
Who is driving the Big Data bus? Data scientists? Mindless algorithms? Content experts and their teams of data scientist support staff? Marketing? Security firms (including those run by governments)? Terrorists?
I say this once, I will say this a million times … Content is Queen.
Algorithms that are primarily empirical without an understanding of the validity of the data being analyzed and the theoretical issues are dangerous.
An algorithm can predict — and I have no doubt several are doing so at this minute — how happy I will be on a global question (how happy are you?) or a behavioral index (at a sporting event, at the bank cashing a check, four days after the death of a parent) or the perceptions of others (just got tagged in somebody’s photo, got mentioned in a tweet, had a happy blog entry, had birthday, just had a child born, got back a favorable medical test result, used a smiley face).
I have observed and analyzed and proposed new ways of measuring “happiness” and “anxiety” and “grieving” and “intelligence” for 40 years. I don’t really know what “happiness” or “anxiety” or “grieving” or “intelligence” is although I do know a lot about how experts have tried to define these constructs. I do know that a blind algorithm is not going to answer the question of what “happiness” is.
Do you want an algorithm driving the bus or someone who knows the limits of current data? I don’t want a blind algorithm predicting whether I am “happy” (and happy enough to buy something). I don’t want a blind algorithm predicting the economy. I don’t want a blind algorithm predicting how many healthcare visits I should receive under health insurance.
Content is Queen. The algorithms that drive the organization of Big Data need to be guided by content specialists (psychologists, sociologists, physicians, nurses, economists, physicists, chemists, bioelectrical engineers, etc.) not data scientists without expertise in one or more of the relevant content fields.
If the Queen rules, all will probably be well in the kingdom. If blind algorithms rule we probably will end up as batteries in The Matrix.
I vote (before it is too late) for the monarchy of content. I am not a battery.


I love to read end of year lists each December. I love to make them too.
I worked on a PC exclusively for 25 years. Two years ago in retirement I tossed the PCs and bought a Macbook Pro. The consequence of having this cool new machine with an operating system that actually worked was that I had to rethink how to use current creative software to replace all of the (Microsoft) bloat on a PC.
This is my list of my favorite apps. Note that I use my Macbook for “professional” activities like writing and surfing the web and blogging and social media and my digital photographs. I do not do games nor software that looks like it was designed for five-year-olds.
You can zoom by clicking on the image.
I use the paid or pro versions because the extra features are useful to me. You might be able to get by just fine with a free or minimal features version.

We have the technology to mine archival text and numeric databases and present the results visually in ways more people can interpret and use.
Collectively the world has spent billions (perhaps trillions) of dollars on basic medical and scientific research in the past decade.
Enough with a small review of a few studies known to a scientific author.
Show me the results.
A proposed paradigm …

Click on the image to zoom.
IMHO, as we used to say in the old days of computer bulletin boards …


