Info

social, health, political imagery through the lens of G J Huba PhD © 2012-2021

Posts tagged visual thinking

A powerful set of tools for journaling are those that create visualizations depicting data, ideas, facts, research, news, evaluations, comments, polls, opinions, feelings, planning, communications, and models of many things. And any other things you can visualize.

Visual data of varying types can be visualized as graphs, diagrams, doodles, models, mind maps, sketchnotes, images, and infographics along with many other types of visual displays.

Visual thinking is underused by those who need to understand and synthesize information for themselves and others. Such methods should be taught and used throughout our educational systems.

Click on the image below to expand it.

by George J Huba PhD (Psychology)

This weekend the American Psychological Association is meeting in San Francisco. While certainly not exclusively so, the meeting tends to be dedicated to the presentation of fairly trivial and limited scope, poorly designed research studies.

Psychology should be embarrassed that the focus of the meeting is not developing new and better ways of addressing psychological problems. For instance, I have dementia. So do many millions of people worldwide. At this psychological meeting, there is little focus on actually improving the lives of persons with dementia. The same is true for many other psychological disorders.

How has psychology failed persons with dementia? The following mind map presents my assessment of the situation.

Why does psychology fail persons with dementia? I believe it is because the field wants to pretend it is a science of the rigor of biology and physics, rather than focusing on becoming an evidence-based way of developing better ways of patient assessment, screening, treatment, and communication. What a waste. And remember that I am a person with degenerative cognitive and behavioral disease and I get it. Shame on psychology.

Click the image to expand it.

by George J Huba PhD (Psychology)

Dementia is a time that gets extremely complicated for a person with dementia and their spouse, family, friends, new social acquaintances, healthcare providers, and caregivers.

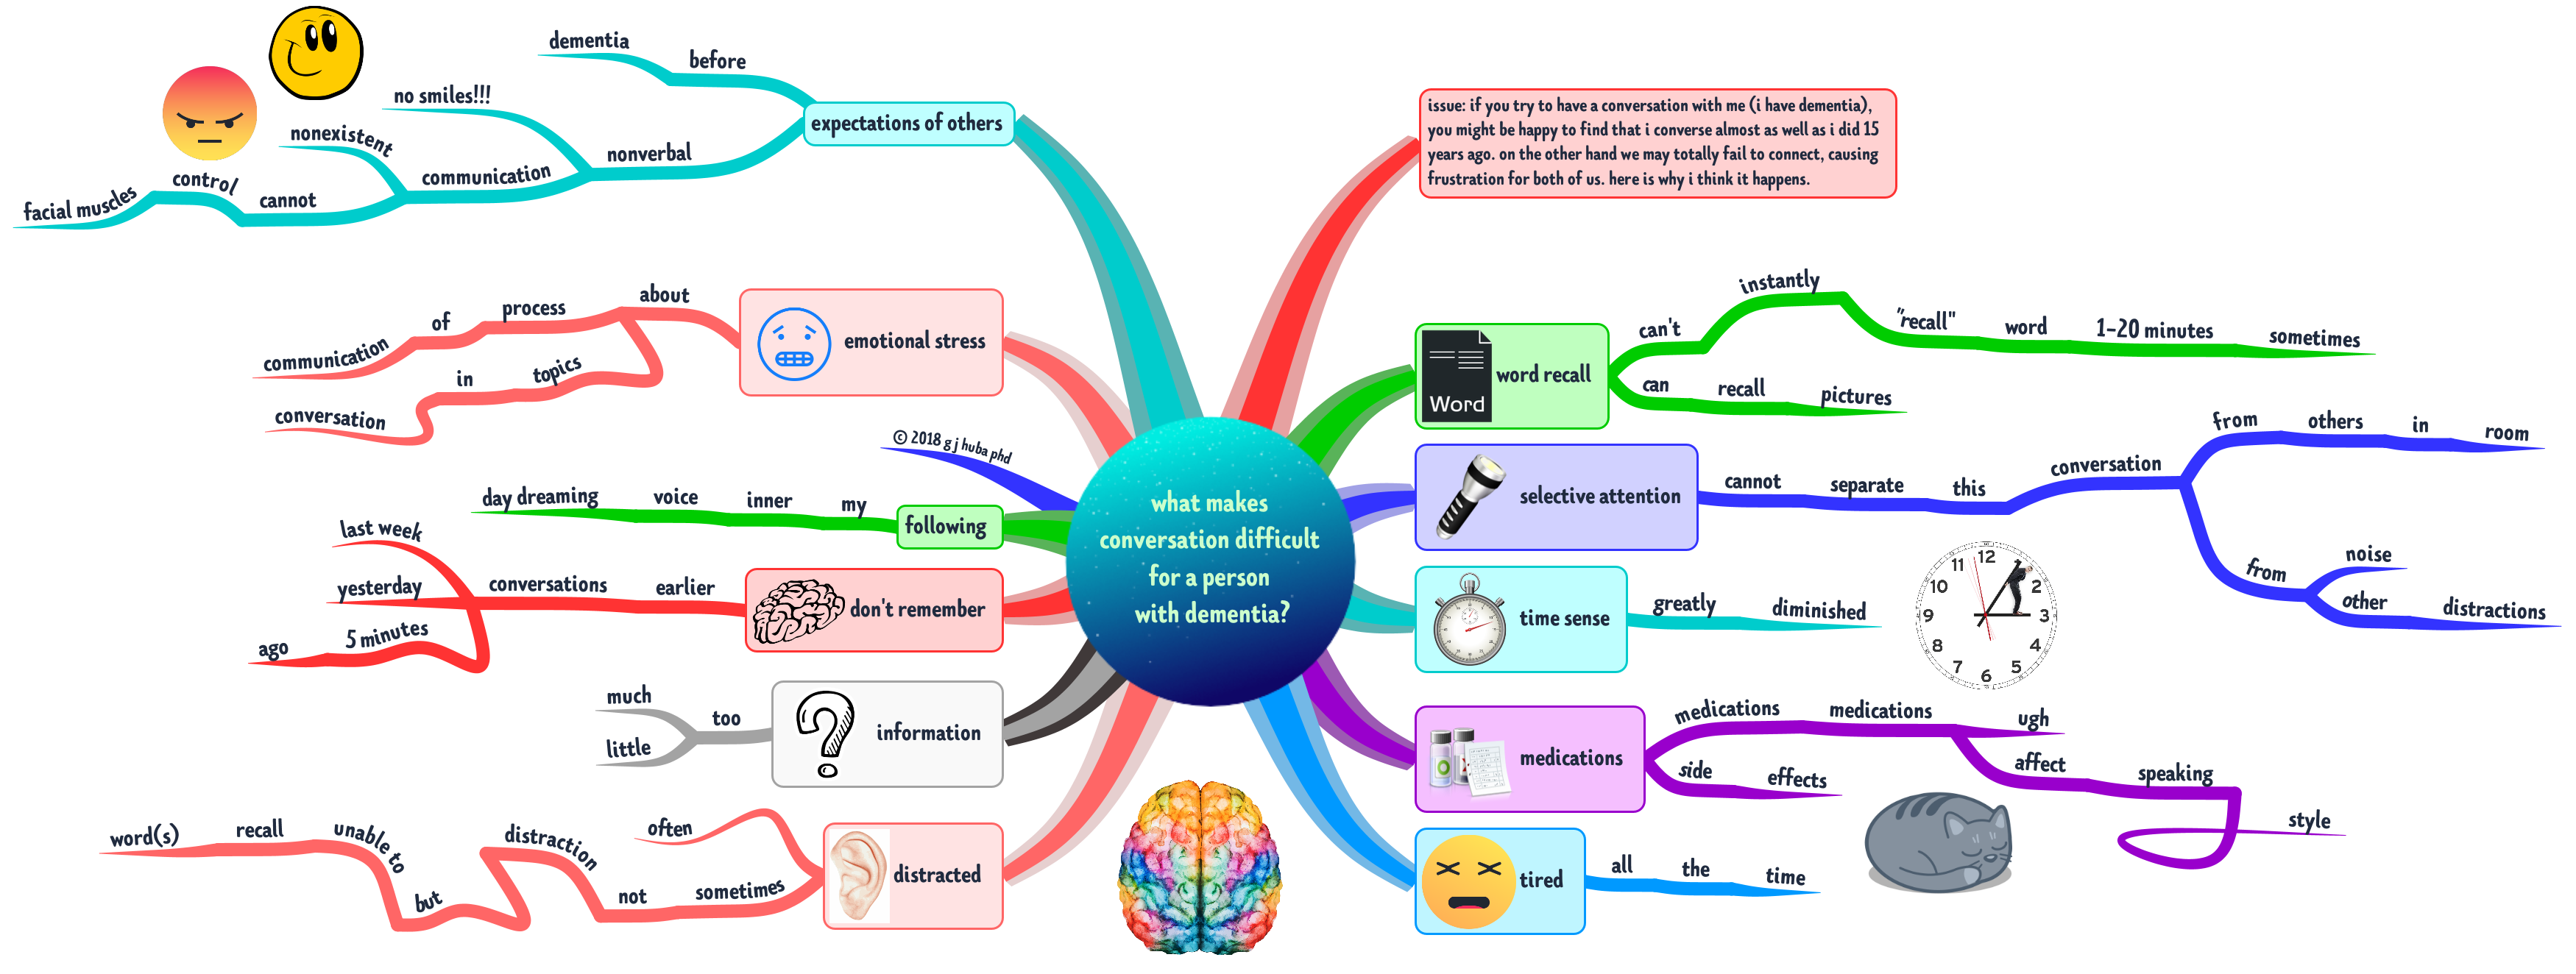
Probably the biggest issue is that those who interact with the person with dementia expect the PWD to communicate in a way that is diminished but still like the way a typical person without dementia communicates just now at a lower level.

It is difficult to communicate with a person with dementia because their own experience of communications is now shaped by the brain changes and other symptoms of dementia. What about your Mom who no longer smiles when you say something she has always liked or when you bring her the pistachio ice cream she has always loved? Ever consider the possibility that she thinks she is smiling but has no control over nonverbal communication such as her smile. Brain damage of various types can cause the loss of nonverbal communication abilities or control of facial muscles.

Why does your friend always get overwhelmed and say something stupid when there are lots of other people around? Perhaps they can’t focus on what you are saying because there is so much noise and motion from distracting sources?

Ever wonder why your friend with dementia comes back with an answer to a question five minutes after you asked the question? Brain changes and damage during dementia may make it hard to retrieve information or think and a loss of a sense of time may mean your friend keeps working on answering the question long after the conversation has moved on.

In dementia, a daydream may be as vivid as something in the real world, and just as distracting. In dementia, you can’t deal with too much information because it distracts you and can’t “fill in the blank spaces” if you receive too little because your “executive functioning” has been destroyed. You tend to get anxious during a conversation not only from unpleasant topics but also from worrying so much about missing a word or forgetting a name or misinterpreting a suggestion as hostile when it was just a normal joke.

The physical and psychological consequences of dementia combine to make it seem that a person with dementia is speaking a different language. They are.

And yes, those 20 or more pills the person with dementia may take daily can affect the ability to speak clearly, pay attention, be sleepy, look like they are bored when they are not, or become even more anxious.

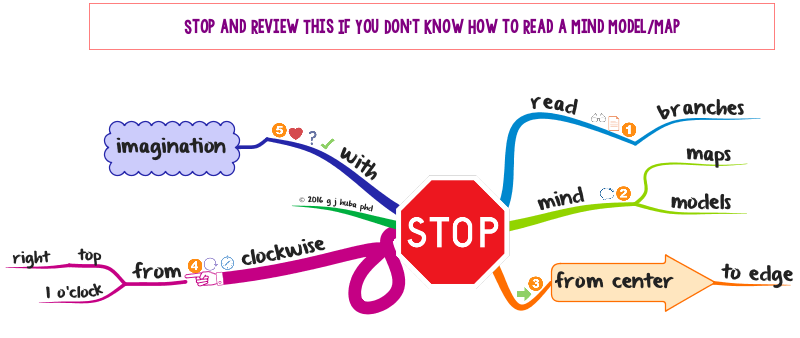
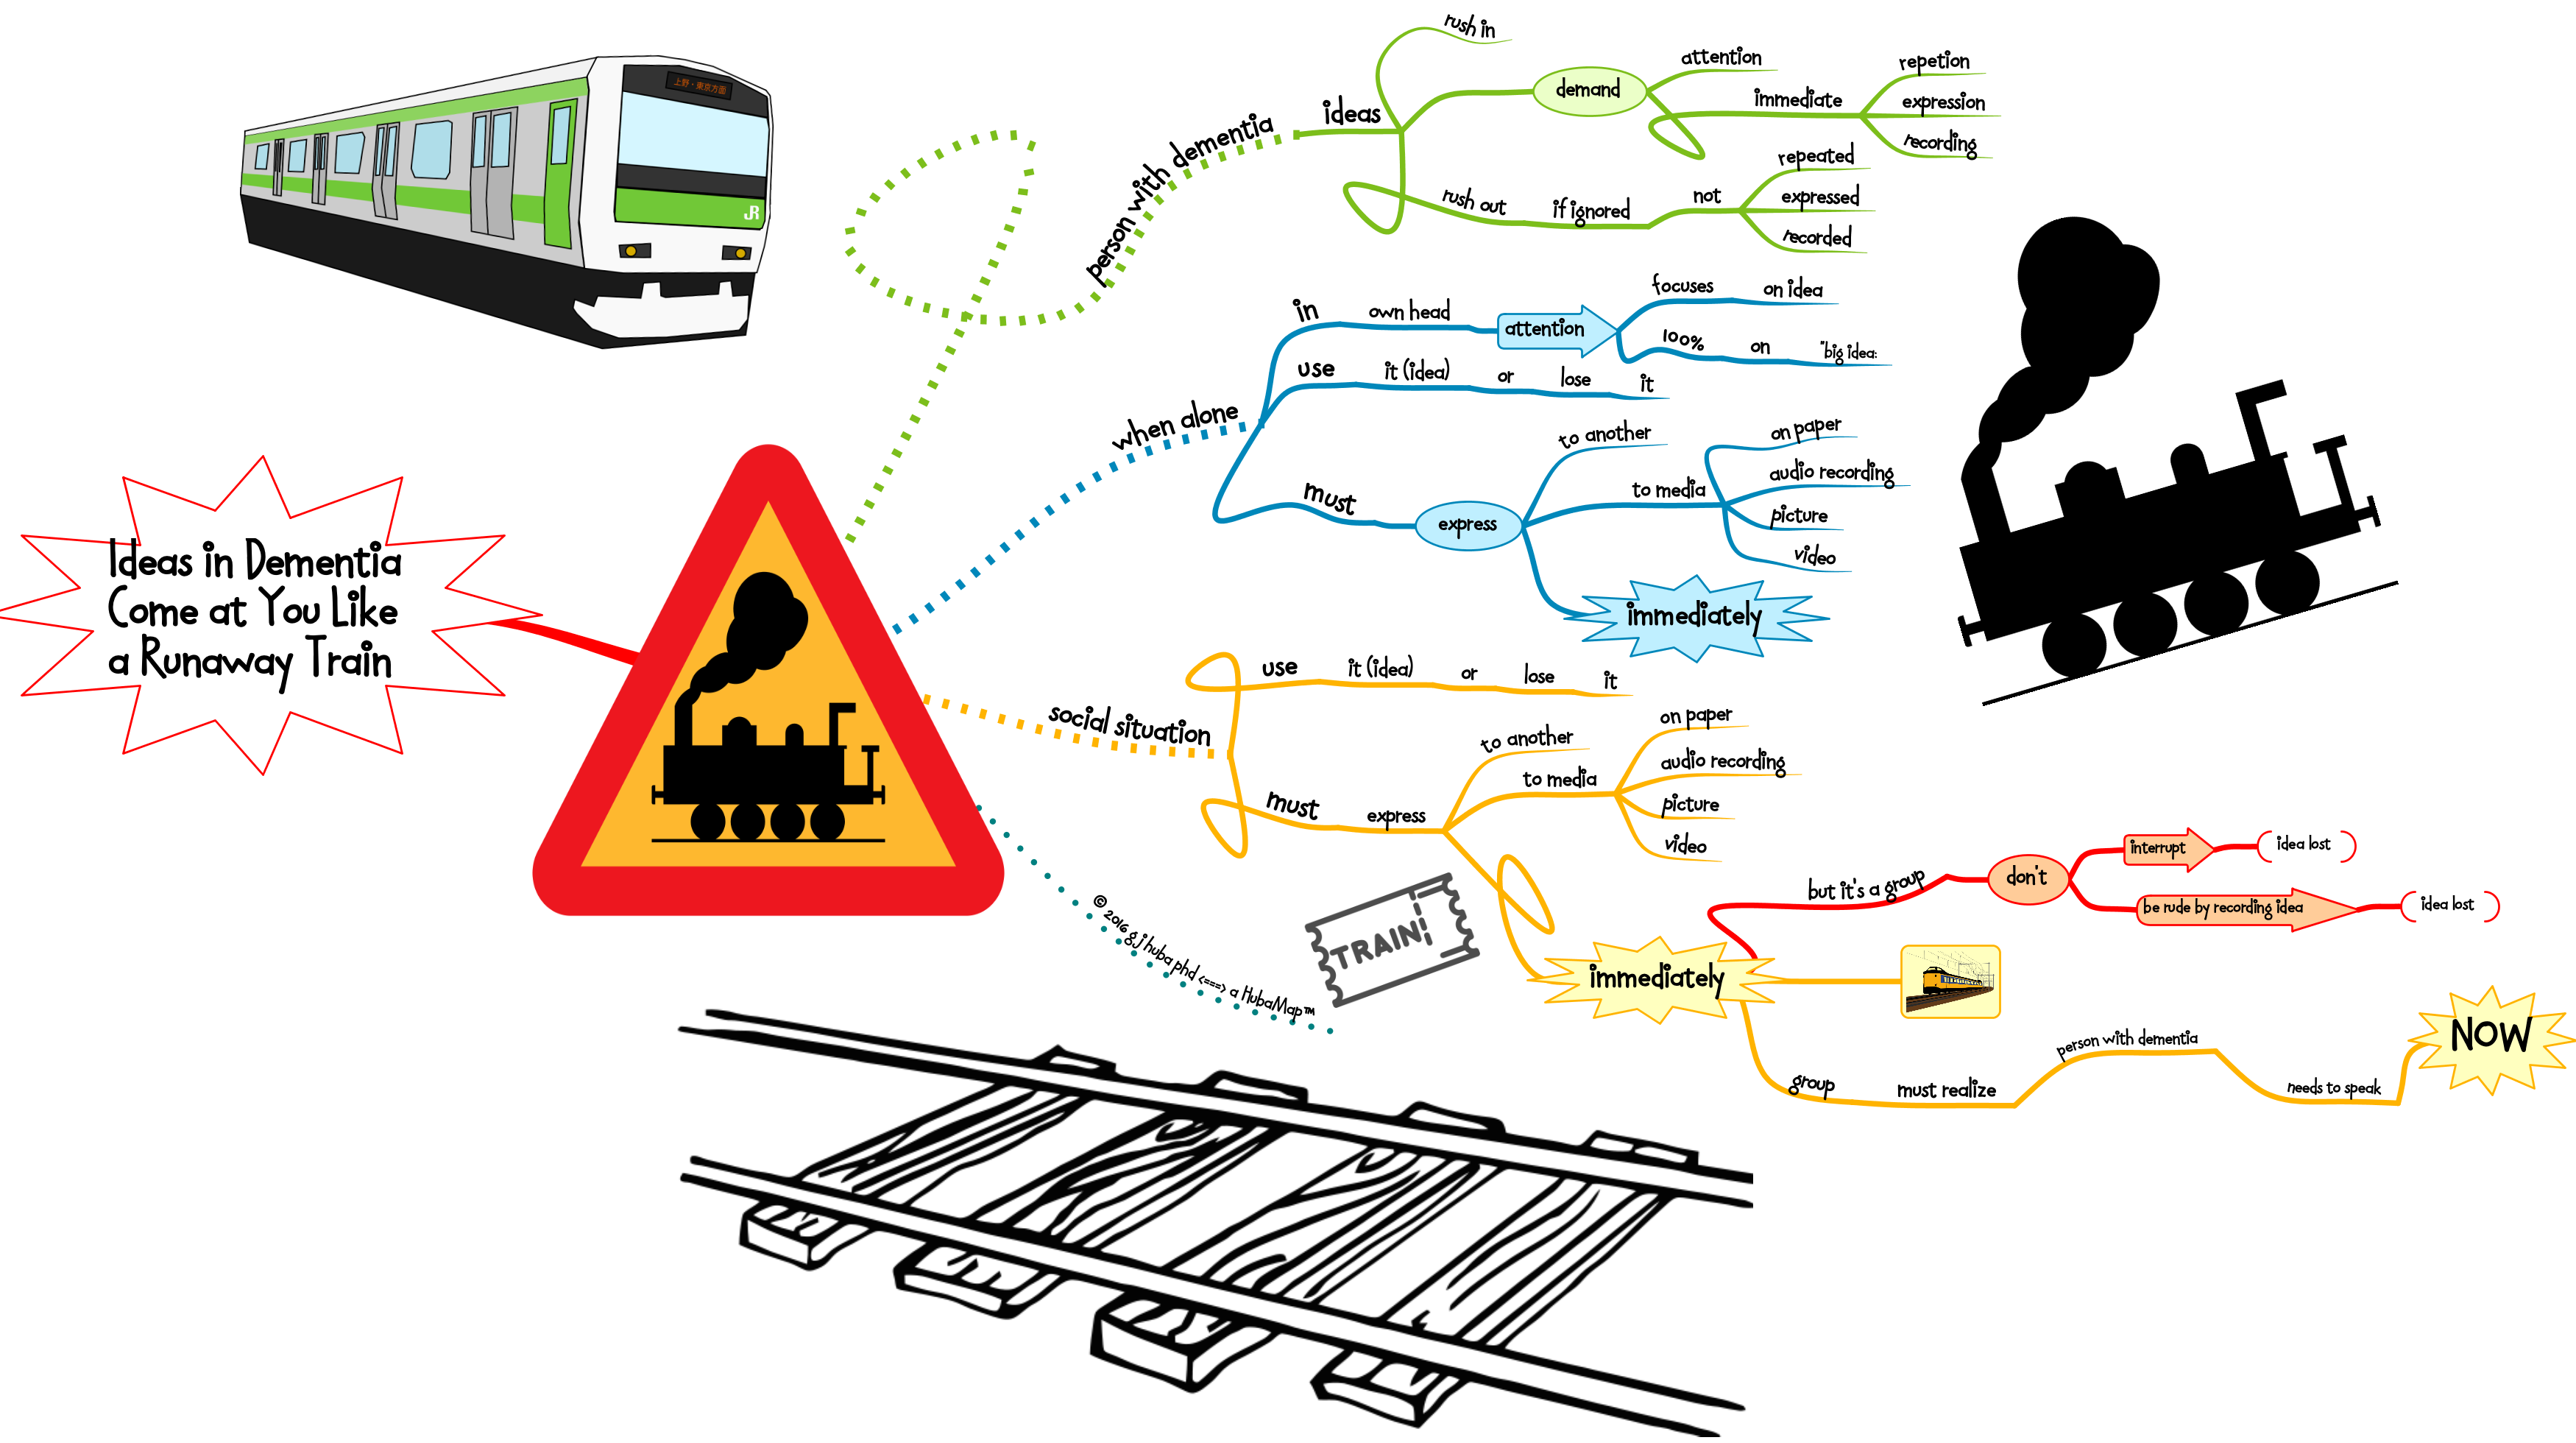
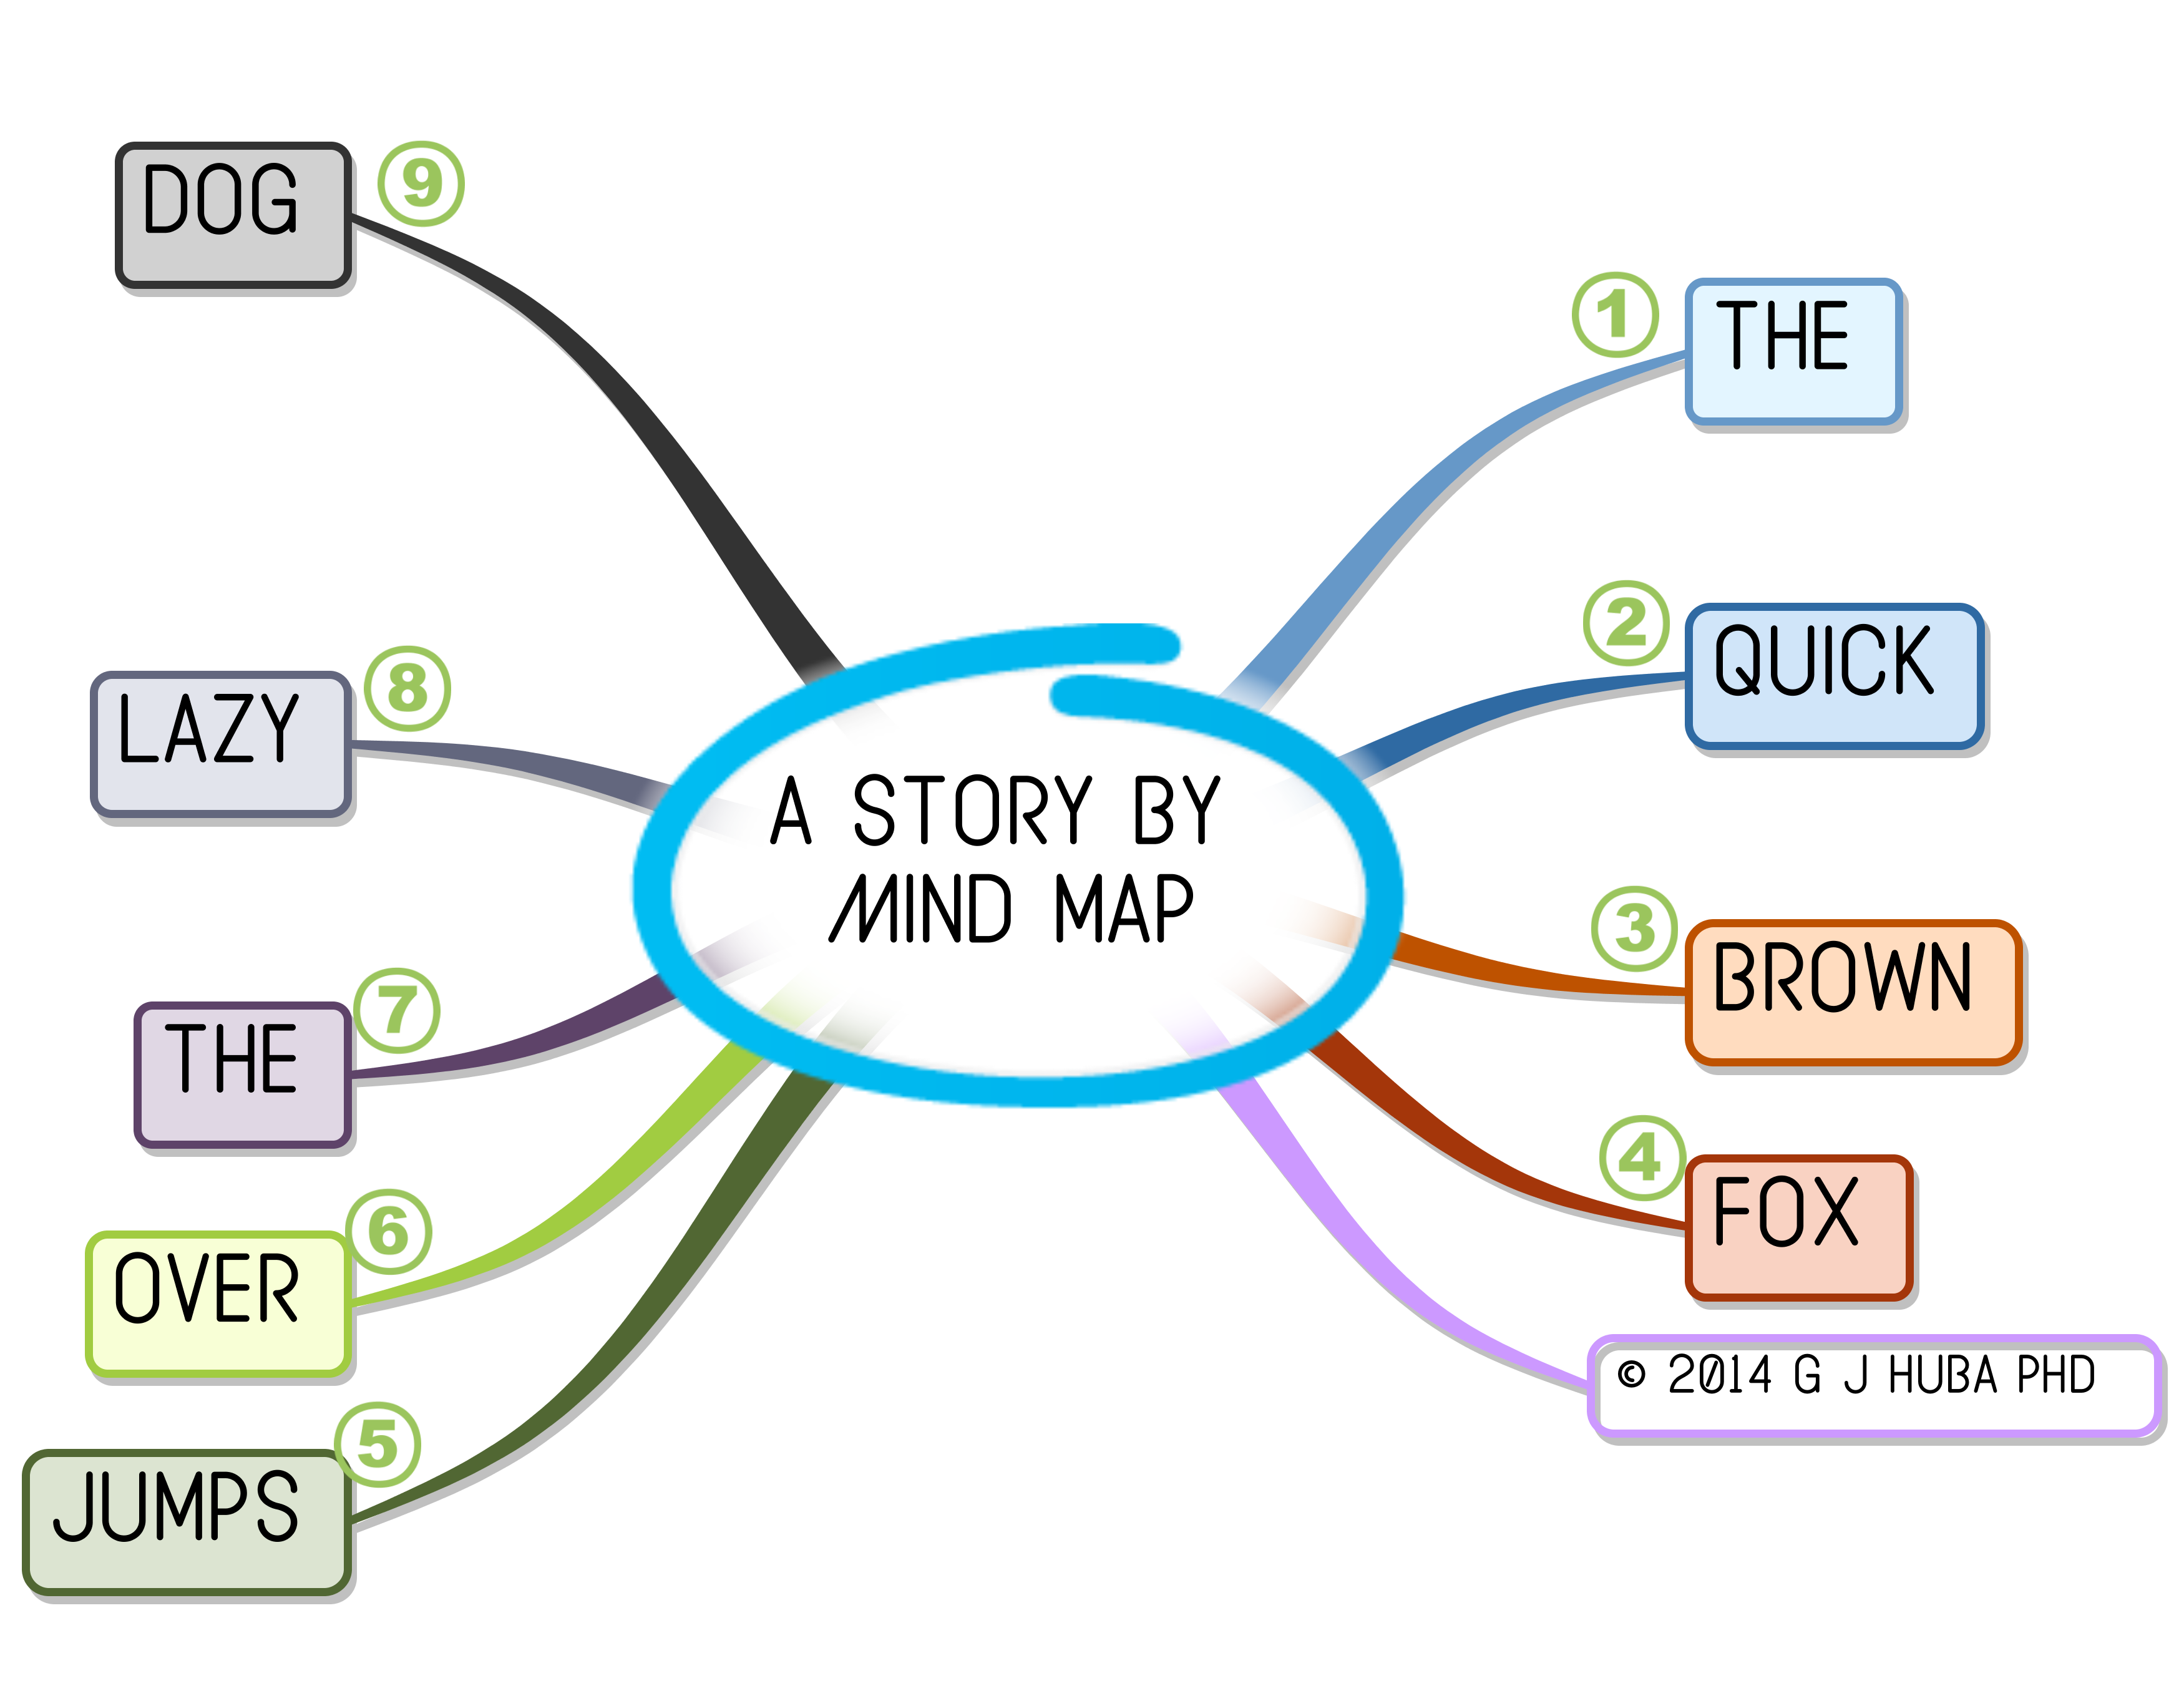
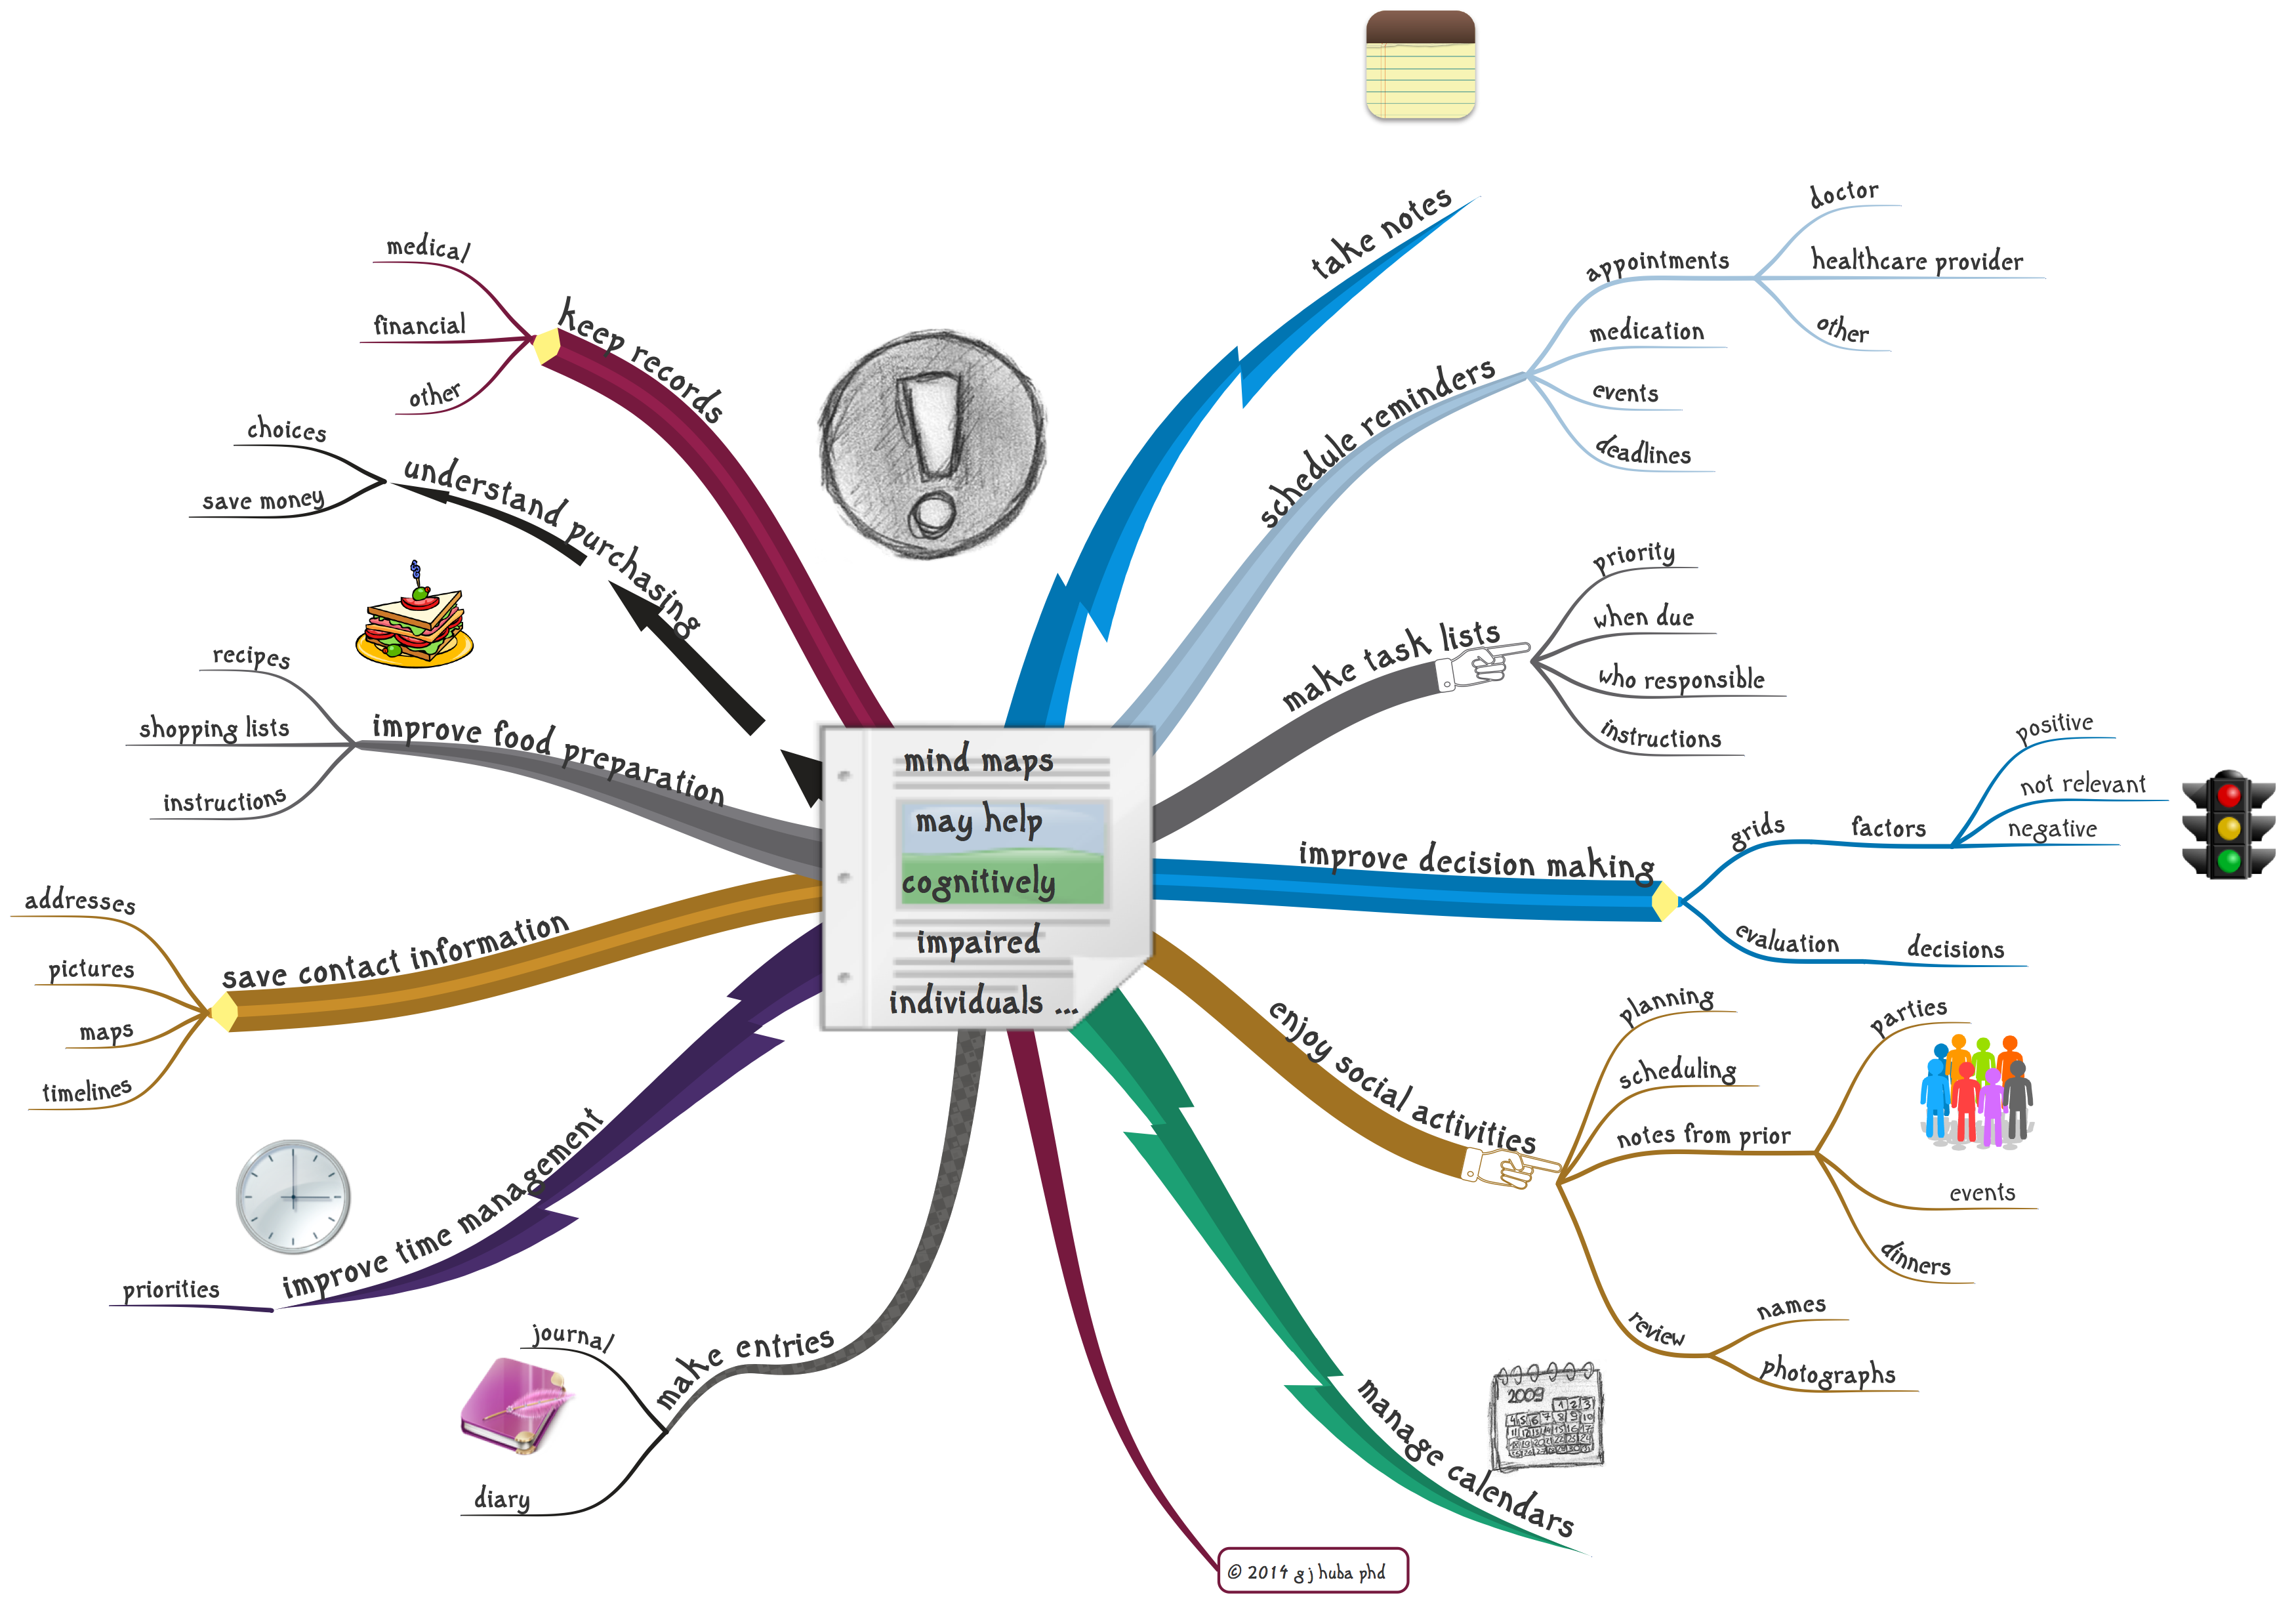
Additional thoughts are arranged on the mind map below.

Click on the image to expand it.

Always try to remember that the person with dementia is often not disinterested or misunderstanding you or too tired to think or extremely distracted in what you think is a peaceful environment.

And if you are a person with dementia, remember that your friend is not trying to mislead you or express hostility and disapproval. They are not trying to trick you or harm you or pick a fight. You might not remember a conversation your caregiver says you had 10 minutes ago, so get over it and trust the other person. Nobody is criticizing you as a person because you can no longer tie your shoelaces or your necktie.

All parties in a conversation with a person who has dementia need to realize that the “rules” for the social encounter have changed because of the disease. Both persons with dementia and their families and friends and caregivers need to realize that is just as hard for all parties to figure out this new “language of dementia.” But it can be done and when mastered can liberate everyone to some degree.

Learn to laugh and smile and enjoy the company of each other again. The positive emotions are still there but they may have to be expressed in different ways. Learn how to express oneself when one or more parties has dementia. It’s worth the time. For everyone.


what makes conversation difficult for a person with dementia


#mindmap #mindmapping #dementia #Alzheimers @DrHubaEvaluator

The #1 thing that I have learned over almost a decade of living with dementia is that thinking in pictures (images, diagrams, doodles, etc.) is much more effective than using words alone. Hedge your bet. Use pictures that associate with words rather than just words. After all, in many types of dementia, you lose your words at the end while the pictures may escape loss.

Try it. You will probably like it. Creating visualizations of important events, ideas, feelings, and other information can be FUN.

I’ve been using visual thinking methods for the past 10 years. They work (for me).

If you have not read the Introduction to this series of posts, it is important that you read it before this post. Click here for the Part 00 Introduction. This post is part of a series of more than a dozen posts.

I worked on understanding health and social service programs, especially for the disabled, poor, disenfranchised, and traditionally underserved as a program evaluator for about 25 years. I was very good at it and worked with hundreds of programs spread over most US states.

In writing about my activities to achieve stability in my dementia and maximize my quality of life, I am going to employ the tools of program evaluation to describe what I was trying to achieve, what I did to achieve my goals, why I did various activities, and which parts of my interventions seemed to help me the most. No, not in this post but in a series of more than a dozen posts.

In this post I will start by describing the activities I designed for myself and did throughout my period of diagnosed dementia over six years of living with the disease. In subsequent posts, especially Posts 02 and 03, I will discuss the outcomes of my activities. After that, I will address some of my activities — and especially those that “worked” extremely well for me — and describe them in depth, show how other individuals might use these methods, and how dementia caregiver and healthcare systems might be built around them.


The image below is a mind map. Should you not be familiar with how a mind map is drawn and read, please search this website for posts on mind mapping using the search box. Or, go to the home page by clicking here and look at the list of pre-defined searches.

A very simple set of rules for reading a mind map is as follows.

  1. Start at the center of the diagram. Each of the topics (ideas or major branches) that come out of the center represents an issue. Important information about the main issues is given as a series of branches. The organization is in an outline or tree where large branches divide into smaller branches and smaller branches divide into even smaller branches.
  2. Think of the map as a clock face and start at the 1 o’clock position (upper right corner). Read outward from the center along the branches and sub-branches to see how ideas and information about the topics can be arranged in a hierarchical or tree structure. [If you could go up a huge fire truck ladder and look straight down, you would see a structure of tree branches that looks like a mind map. When we study or read a mind map, we are looking at a whole tree — set of information — and then seeing how small and more specific information spreads from the trunk.]
  3. Go around the map in a counter-clockwise manner (to 2 o’clock, 3 o’clock, etc.), following the branches down to their branches and their branches and finally to twigs. Remember that we are looking down at a whole idea [or tree] and its branches and their branches in order to understand how the information represented on these branches goes together and what the most important information is.
  4. The mind map is thus a picture of major ideas followed by its major subdivisions or branches and sub-branches. The “big ideas” are attached directly to the central issue.
  5. A mind map is a way of showing in an image how a set of data pieces or ideas go together.
  6. The pictures, color coding, and fonts are used to designate what is the most important information in the mind map. When you are trying to remember or organize or determine priorities, the pictures, color coding, and size of the fonts can help you store information in “visual” parts of the brain and then retrieve it by thinking about pictures, the color coding, or size-importance of the information.

Click on the mind map to expand its size and zoom to various portions of the map.


As you can see, I tested app after app after app on my Mac and iPhone to see which could help me. I read all about how to mindmap and draw sketchnotes and I practiced and practiced. I learned to read “dog” and taught my Newfie to understand “people.” I doodled, watched the news, built a highly-rated social media following of more than 140,000 individuals interested in healthcare, dementia, visual thinking, and 100s of other topics from around the world. I went to concerts, watched movies, and cheered for the two local universities with huge sports programs. I engaged some new parts of my brain. I thought in pictures.

  • I HAD FUN.
  • I LEARNED MANY NEW THINGS THAT STRETCHED MY BRAIN INTO NEW CHANNELS.
  • I BUILT COGNITIVE RESERVE.
  • I THINK I PROVIDED NEW INFORMATION TO PERSONS WITH DEMENTIA AND COGNITIVE DECLINE, CAREGIVERS, HEALTHCARE PROFESSIONALS, AND THE GENERAL PUBLIC. I FEEL GOOD ABOUT THIS.
  • I HAD FUN.

Stay tuned, the interesting stuff starts next.

Want information you created or curated to have the greatest impact? Then put it into a mind map. Not a mono-toned mess of straight lines at right angles but curves with colors and an organic style. A mind map utilizing rules that follow what is fairly well known about visual thinking. A mind map like the one below.

Click on the image to expand it.

Conditions Under Which the Impact of a Mind Map is Maximized

NOTE: Version 11 OF iMindMap was released the first week of May 2018. At this time (7-1-18) I have been using the program for about two months. I will have a full review posted within a week or two. As a brief note, Version 11 includes a number of enhancements. The program remains the best one for mind mapping and the updates made from Version 10 to 11 are significant and worth the upgrade price.

I doubt that there are many people expert in mind mapping who would disagree with me that iMindMap is the most feature-laden of the more than 100 programs for mind mapping to be found all over the Internet.

Once a year — as promised when the program was first introduced — iMindMap has a new release that provides many new features and usability enhancements. And unlike others, they produce a great upgrade every year on time. And free from most bugs that live in Cupertino and Redmond.

How good is iMindMap 10?

Click on the mind map (actually mind model in my terminology) below to expand its size. For those of you with no patience or dramatic sense of the big build-up, you can skip directly to the “9” branch. iMindMap is the 8,000-pound gorilla.

As a note, my review was conducted about six weeks after receiving the program and using it exclusively rather than earlier editions. I use a Mac only, and my review was conducted on a 2013 MacBook Pro. I have worked with the program both on an internal 15″ retina MacBook screen and a 27″ external monitor. [I actually like using the MacBook screen rather than the larger desktop monitor.]

imindmap-10-review

Chris Griffiths and his team at OpenGenius have taken the work of Tony Buzan and in the process of developing a program expanded and formalized that conception in a creative way that is brilliant in its overall utility and ease of use. iMindMap 10 is my favorite mind mapping program, but most importantly my favorite and most useful thinking tool. For those of you who do not follow my blog in general, I live with Frontotemporal Dementia and iMindMap has served as a “brain assistance tool” for me since 2010 in daily living and in continuing my professional interests in a creative way. I can accurately say that the various versions of this program “changed my life.”

This is a tool formulated by expensive consultants who want to help corporations make more money while at the same profiting from that help. But the tool has come to greatly exceed the original vision and is intuitive to use and most adults and all children can learn to use the program for free using Internet trainings. Don’t be scared off by all of the publicity about a $3500 training and a certificate signed by a consulting firm (not an accredited educational institution). You do not need a course to learn this program and it is not clear to me that expensive courses help you learn to apply this program in the real world. If you are willing to invest a few hours you can be doing adequate mind maps; if you invest 10-20 hours you can be doing accomplished mind maps.

Get over the hype and realize that you CAN learn this program quickly on your own and even more rapidly if you study examples available without cost at many blogs including this one (Hubaisms.com), a depository of many thousands of mind maps at Biggerplate.com, and many other sites including youtube.com where many training sessions are presented.

While there are four “views” in this program, the primary mind mapping module is the reason for using this program. The other three views are largely alternate ways of looking at the same information and data. While they may be “quicker” ways to collect information together from a lecture or library research, at the end they feed their data into the mind mapping module where the actual thinking work, theory building, model development, and communication is done.

I have a few criticisms of the program, but these criticisms do NOT change my overall rating of the program as A+.

  1. The time map module is really just a Gantt chart of interest to but a few mid-level corporate managers and high level executives who have not yet adopted better ways of team management. As a Gantt chart the module is fine, albeit about the same as most existing software in that area. Unless you are like a friend of mine who manages 10-year projects to send landers to Mars with 10,00 team members, I cannot imagine why you would want to use a Gantt chart.
  2. In my view and that of many other potential users, a “time map” is actually a timeline that incorporates mind map features. While others have tackled this issue (most notably Philippe Packu and Hans Buskes), my formulation was the original. The resulting blog post (click here for a new window) has been the most read one about mind mapping methods on my blog site for FOUR years. I’d urge the iMindMap developers to look at my model of time maps which requires a lot of custom work that I am sure they could easily automate.
  3. For almost all mind map users, the future is using pre-made templates designed by content experts. Purchase a template package and then you can then create your own mind maps by adding your information to the pre-designed expert map for your area whether it be healthcare or project management or writing a term paper or designing a research project or selecting the right clothes for a 5 day business trip. At this time iMindMap does not yet have a way of protecting the intellectual property of template developers which provides little incentive for developing templates as a business and therefore stunts the growth of the mind mapping community.
  4. For this program and all of its competitors, the icon and image libraries are never big enough. On the other hand, you can purchase separate icon and image sets from third-party packagers on the Internet if you have special image needs. iMindMap allows you to use such external pictorial elements extremely easily. My favorite new feature is that you can add icons to their library and size the icons in a custom way. iMindMap’s included images should more fully capture the fact that users of mind maps and their audiences are much more diverse in terms of ethnicity, race, gender, gender-orientation, education, and age than the included image libraries. And hey OpenGenius folks, how about some icons for numbers in colors besides orange and lime so that the color schemes of my mind maps are not destroyed if I number ideas.
  5. More free online trainings would be desirable, and most importantly trainings that do not run at the speed of a bullet train. Two minute presentations that cover 20 minutes of material are somewhat counter-productive. The current videos run too fast for new users and at time for even the most experienced users.
  6. My experience — admittedly infrequent — is that Technical Support is fairly “rigid” in that there are lots of forms to fill out before you get a real chat session going and too many requests to send them esoteric files on your computer. All in all, as technical support goes, while everybody is trying quite hard to be helpful, they ask you to conform more to what is convenient for them than what a confused user can deal with. When I want help or to make a suggestion or make a request for a new feature or default, I want to just compose a short email so OpenGenius can get the right person there in contact with me. I most definitely do not want to complete an overly complicated form. Too much technocracy in that process.
  7. Besides the books of Buzan which are not all that useful for learning the program or how to do real visual thinking in real world applications other than rudimentary management, OpenGenius needs to develop some easier access, very practical books that act as “manuals” and present information in more comprehensive ways than is done now. Old fashioned manuals that are (or can be) printed have a lot of appeal to many.

In summary, this is an amazing program that is much more than a program for mind mapping. It is unsurpassed among mind mapping programs. Additionally it is what I call a “visual thinking environment” or VITHEN. My “criticisms” are minor and do not in anyway diminish my overall evaluation of the quality of the program.

My blog at Hubaisms.com on which you are reading this review was designed and “written” largely in “iMindMap.” Most of the mind maps I use to guide my own “complicated” life were developed in iMindMap.

Exemplary job folks at OpenGenius. Version 10 is an additional large step in the evolution of the program and mind modeling.

The mind model (aka mind map) below discusses my vision in developing the dementia focus on this website. I started to build the web site about two years after being diagnosed with a neurodegenerative condition (2012). Thus the entire blog is the work of a developer experiencing dementia while designing and preparing the content for the site. The site discusses my progression through cognitive impairment and decline into dementia. More importantly it discusses how I tried to help myself coordinate and use to full advantage the support and professional expertise made available to me by family, friends, the community, my doctors, and the general world-wide of patients and professionals the major issues.

Nothing in this blog post (or any other on blog post or page on the site) is intended to be, or promoted as medical, psychological, or any other form of treatment. The ideas in this blog are about using some commonsense note-taking and visual thinking methods to possible help you live better with dementia. I tried it on myself (only) and I am encouraged although I freely admit that full scientific study is needed.

These methods and comments will not substitute for medical and other professional treatments. They do not cure dementia. They do not slow down the progress of dementia. For me, at least, the methods have sustained and increased my quality of life and I do spend more time with my family and am more independent and in my opinion think better. But my dementia is not being treated and getting better; what I propose are methods that may make it easier to independently manage selected parts of your life, be in a better mood because you are trying to help yourself, be less of a burden to your caregivers, and report better to doctor what your experiences have been since the last appointment.

Many people are miserable almost all days when they have dementia. If simple, inexpensive cognitive tools can improve some or many of those days, the development of such techniques is a huge step forward.

I hope that others will examine the information here and use it to improve the decisions they, their caregivers, and their doctors and nurses must make about their formal medical treatment.

Here is what appears in the blog posts and elsewhere on Hubaisms.com.

Click on the image to expand it.

why-i-developed-the-hubaisms-com-focus-on-dementia

Click here to see Part 2 of My Vision in a separate window.

still-crazy-after-all-these-years

Not the past, not what might happen in the future. Fuzzy, intuitive, today’s emotions. Nonlinear, visual, big picture. Attention flows toward good, bright, happy visualizations.


mind-mapping-mind-modeling-may-promote-mindfulness

Opening your mind to nonlinear thinking may provide a cognitive reserve that helps you as cognitive functions start to decline perhaps precipitously into dementia. Neuroplasticity is a mechanism that the brain will use to reassign functional processing from one area to the brain as it is damaged by trauma or disease.

One very good way to encourage the development of cognitive reserve and neuroplasticity is to practice nonlinear thinking methods that can help promote mindful solutions. Should the brain become damaged, it may be able to use nonlinear, symbolic visual thinking to cope, at least for a while. And while you practice you may also experience strength in your resolve and understanding.

Do note that the above comments are speculative. There is NO formal research on mind mapping or other comments about this in the literature (other than my own). Also, this is based only on my own experience and generalizations from my earlier research on daydreaming and imagery. So do not go about thinking that this proven. Rather it is speculative.

While I theorize that mind mapping is related to mindfulness in SOME applications, even if it turns out that it is not — from the results of formal empirical studies — there are other demonstrated benefits from mind mapping, so the actual use of mind mapping should still be encouraged.

One way that healthcare communication can be made more effective is to supplement or replace traditional pages of small-type textual information with graphic displays such as mind models (AKA mind maps), sketches, graphs, and infographics.

This post focuses on mind models (mind maps). The same general arguments would apply to sketches, graphics, infographics, and other visual information methods designed to promote a more effective patient-oriented healthcare system with more complete, accurate, and easy-to-understand information for all.

If you are not familiar with mind models (mind maps), you should look at the mind map at the bottom of the page first (Footnote).

To expand the graphics, click on the images.
effective-healthcare-mind-models


Footnote

stop-read


There are many problems that can plague a person with dementia. Some of these are easily detected but others may be “hidden” because of the nature of the major symptoms of the disease or “hidden” because the person with dementia (or caregiver or in some cases family members) is trying to hide some of the problems from outside observers.

For instance physical, psychological, or financial abuse will be hidden by the abuser and perhaps the person with dementia. Memory loss may make it difficult for the person with dementia to accurately report accidents.

It is important that healthcare providers, caregivers, and family members be trained to identify the hidden problems.

To some degree or another, it is likely that most persons with dementia have some of these hidden problems. For instance, I bump against things all day long, usually because I am rushing around or not paying attention because I am trying to multitask. When asked by a family member or friend where the bruise came from, I have to try to reconstruct where the accident must have happened by thinking through a lot of alternatives for a bruise half-way between my ankle and knee.

Click image to expand.

some-hidden-problems-among-persons-with-dementia

A mind model (aka mind map) on the way that ideas hit you when you have dementia.

In a group, the need to say something immediately before you forget it often takes a backseat to etiquette rules of waiting for your turn to say something and not interrupting. If you are talking to someone with dementia, consider cutting them slack and letting them jump in when they can. If the group won’t let the person with dementia break in it can lead to both a sense of frustration for all and quite frankly, the loss of some good ideas and interactions.

The current rules of etiquette do not take account of the fact that some of the participants in an interaction will have severe cognitive impairment or mental illness that pretty means that if a thought is not expressed immediately it will be forgotten.

Sometimes rules need to be stretched or curved (like a railway track) and patience exercised. This is one of those times.

f I am trying to blurt out an idea to you, believe me that if I don’t say it immediately it is going down the track far, far away from me. And it may not come back for another five minutes (if at all).

Click on the image to expand.
ideas-in-dementia-come-at-you-like-a-runaway-train


Blockheads-23


I have been a HUGE fan of the Olympics since I was a very little kid. In 1984 I got to go to the Olympic events in Los Angeles every day for two weeks, on many days with my father. That was the year that the Soviet Union boycotted the games because the USA had boycotted the Moscow Olympics in 1980. Heck, I thought it was great — the USA and East Germany (who came) won all of the gold medals! Months earlier when local pundits in Los Angeles said Los Angelenos were too apathetic to purchase expensive Olympic tickets especially with the Soviets and most of the Eastern Bloc boycotting as it would not be a real sporting event, I had bought as many tickets for the “finals” as I could get my hands on. Later I sold the extra tickets as Los Angeles fell in love with the games. I made so much money that the expensive tickets I had bought for the entire family of 7 that we used ended up were effectively free since the profits covered the cost of the tickets we used. Street enterprise at its best. My tickets became worth more because the Soviets didn’t come as all Americans became Olympic fans the year we won all the golds.

Winning the race to live well with dementia is like running the 10K race at the Olympics. Everybody has to pace themselves at the beginning so that they can learn about their opponents. In the final stages of the race they speed up and sprint their fasted the last 200 meters.

A mind model of the dementia race strategy is shown below. Click the image to expand it.

I think I am winning my race to live life to its fullest while having dementia. I’m getting ready to claim that gold medal. You can win your race too. Think about what you are doing and strategize like a 10K runner. Learn all you can in the beginning and then speed up later as your new knowledge kicks in.

race-2-bigger


3d-race


Blockheads-23


Ever wonder what the difference is between Mind Map techniques developed by Buzan and Mind Model theory and techniques developed by me?

Probably not.

At any rate, just in case you have an itch to figure out the difference later, here is a cheat sheet in a Mind Model. Click on the image to expand it.

Mind Model vs Organic-Style Mind Map

Did that get rid of the itch?

In general, mind mapping programs do not export their maps to other formats or seem to export it in a way that seems unnecessarily difficult and at a great loss of the work that went into developing the map in the initial program.

I have never heard this said so bluntly, but let that not stop me from stating the real issues here.

For companies to refuse to promote interoperability of mind maps among their programs (or heaven forbid to develop a common standard file type for mind mapping) makes an assumption that is directly insulting to the user.

That assumption is that you no longer own the rights to your own mind map — specifically to move the ideas easily from program to program — once the map has been worked on in a specific program.

Fortunately Microsoft and Apple got past this nonsense by using easily converted file types that do not lose features between Word and Pages as well as Excel and Numbers. Most other companies make good translations among word processing, spreadsheet, and presentation programs.

I move files between word processing programs all of the time because it is easier to do specific types of formatting in some than others. Frequently I compose in one program in Markup and bring it into the “high feature programs” for creating camera-ready copy. That is my right. I paid for all copies of the programs I use and the text and earlier formatting is my intellectual property.

If you really think you have the best mind mapping program, the best way to prove it is make it easy to import files from another program AND to make easy to export files. After all, if your program is the best users will quickly find that if they move files in from another program they have much better mind maps. Similarly, if your program is the best users will quickly find that if they move files from your programs the minds are not as good.

The principles are quite simple.

I own the content of my mind map.

I own the cumulative formatting I have done on my mind map whether done in one program or many different ones consecutively.

As a customer I find it offensive that you try to limit my ability to make consecutive formatting changes in different programs by having limited or no exporting of my formatting or by not properly interpreting the formatting done in another program.

This is capitalism at the expense of the customer’s right to change products mid-stream because each has different features the user would like to combine. So long as I pay for legal copies of all the software I use, I should be able to combine the use of any with that of any other program while retaining the work I have already done in another program.


screen_0089 screen_0088 screen_0087 screen_0086I consider John W. Tukey to be the King of Little Data. Give him a couple of colored pencils, the back of a used envelope, and some data and he could bring insight to what you were looking at by using graphic displays, eliminating “bad” data, weighting the findings, and providing charts that would allow you to explain what you were seeing to those who had never been trained in technical fields.

Tukey’s approach to “bad data” (outliers, miscodings, logical inconsistency) and downweighting data points which probably make little sense is what will save the Big Data Scientists from themselves by eliminating the likelihood that a few stupid datapoints (like those I enter into online survey databases when I want to screw them up to protect privacy) will strongly bias group findings. Medians are preferable to means most of the time; unit weighting is often to be preferred over seeing too much in the data and then using optimal (maximum likelihood, generalized least squares) data-fit weighting to further distort it.

Few remember that Tukey was also the King of Big Data. At the beginning of his career, Tukey developed a technique called the Fast Fourier Transform or FFT that permitted fairly slow computing equipment to extract key information from very complex analog data and then compress the information into a smaller digital form that would retain much of the information but not unnecessary detail. The ability to compress the data and then move it over a fairly primitive data transmission system (copper wires) made long distance telephone communications feasible. And later, the same method made cellular communications possible.

Hhmm. More than 50 years ago, Tukey pioneered the view that the way to use “sloppy” big data was to distill the necessary information from it in an imprecise but robust way rather than pretending the data were better because they were bigger and erroneously supported over-fitting statistical models.

Hopefully it will not take another 50 years for the Big Data folks to recognize that trillions of data points may hide the truth and that the solution is to pass out some red and blue pencils and used envelopes. Tukey knew that 50 years ago.

All it “costs” to adopt Tukey’s methods is a little commonsense.

Hhmm, maybe the Tukey approach is not so feasible. Big Data proponents at the current time seem to lack in aggregate the amount of commonsense necessary to implement Tukey’s methods.

Turn off the computers in third grade, pass out the pencils, and let’s teach the next generation not to worship Big Data and developing statistical models seemingly far more precise than the data.

John W Tukey

The majority of the posts on this blog are about using visual thinking methods — of which I think that by far the best is #Buzan-style organic mind mapping — to understand, explain, evaluate, and communicate about healthcare. A lot of my own thinking has focused on using visual thinking techniques to potentially improve the quality of life of those with cognitive impairment and dementia.

Tony Buzan and Chris Griffiths and their colleagues and staff at ThinkBuzan have done a very comprehensive job at getting many of Buzan’s ideas embedded into a general purpose computer program (iMindMap) which provides a general visual thinking environment, of which mind mapping is a special part. There are many computer assisted mind mapping programs, but I have concluded that iMindMap is by far the best for creative visual thinking and communication, in no small part because it fully incorporates Buzan’s theory and theoretical implementation.

Like scientists and management consultants and educators and healthcare providers and patients and patient caregivers and students and many others, illustrators struggle with how to best use visual representations to support better thinking and communications.

Which brings up this beautifully conceived and executed little book that I have found to be mind expanding and liberating in how to develop and use a series of illustration techniques and “tricks” to look at things differently when trying to make creative breakthroughs.

Whitney Sherman is the author of the book “Playing with Sketches” which provides 50 exercises which collectively will change the way you think about creating images to understand and communicate ideas.While Ms. Sherman wrote the book for designers and artists, the techniques will be just as useful for visual thinkers in science, education, medicine, industry, and other fields. The beauty of Ms Sherman’s exercises is that in showing you fairly simple ways to make hugely informative and well designed images, the tools will themselves suggest many applications to visual thinkers of all types.

And, I have found that Ms. Sherman’s techniques can be used by the severely artistically challenged (of which I am one); the techniques are ones for Visual THINKERS, not necessarily artists and designers.

I have mentioned this book before in much less detail, but in the months I have used the methods, I have found that they WORK very well to facilitate creative visual thinking. For me they have promoted a breakthrough in how I see the visual thinking canvas.

Get the book, try some of the techniques (pick a random one here and there to start), discover that great artistic talent or aptitude is not required, and see how the techniques fit the information you study in search for better healthcare or disease prevention or decision making or facilitating creative group processes.

In partnership with Tony Buzan’s techniques for organic #mindmapping and Mike Rohde’s framework for #sketchnoting, the techniques codified by Whitney Sherman provide very powerful visual thinking tools.

Ms. Sherman’s website is http://www.whitneysherman.com. She tweets at @Whitney_Sherman. The book is available from major online book sellers.

2014-10-26_21-24-51


I will be posting some examples of using the sketching techniques of Ms. Sherman to developing assistance and communication techniques for those with cognitive impairment or early-mid stages of dementia.

2014_10_27_08_51_03


2014_10_27_08_51_05


This is an old story often repeated as it was typed every few hours by telegraph operators in the 1800s to test the lines. And, everyone learned to type it. The story (sentence) of course was used because it contains every letter of the English language.

[My repeated attempts to come up with a short, single sentence that is hip, cool, trendy, and oh so 21st Century, and contains all 26 letters of the English alphabet has been a failure as of this date. I am working on it.]

At any rate, everyone knows that “The quick brown fox jumps over the lazy dog.”


a story By  Mind map SHORT 2015

But, do you know the background research?

a story By  Mind map LONG 2015

The same “research notes” presented in summary or full form can present a sentence or a short story.

[OK, so it wasn’t really a Newfie. However my lazy, sleeping, snoring dog has been practicing for the part for years, so I let her have it. And yes — really, truly — I have had both foxes and coyotes in the front yard of my current house. I guess I could also have said that the fox was rabid (most are) but that would have changed the rating to PG-13.]

Geek Boy - Two Thumbs Up

Etiquette in the Era of High Levels of Adult Cognitive Impairment and Ubiquitous Mobile Tablets

A little role playing exercise.

What is going on? The person (with dementia) sitting opposite you at the restaurant just pulled out an iPad and connected to the Internet. Is it rude or something else? Perhaps that person is using the iPad to look up information on the Internet (or iPad)? As technology progresses and behavior interventions are introduced for cognitive impairment, that is not an unlikely possibility.

Now, put yourself in the shoes of the person with cognitive impairment. Why might you want to consult your tablet or smartphone? How would you feel? How would your dinner companion see you. Rude? Shouldn’t. You are very very smart.

Oh, and real life, I am the guy with the dementia and iPad. Even when you do not need it, it is quite reassuring that it is there. I don’t leave home without it.

if a person with cognitive  impairment (me) pulls out  a tablet or smart phone  in the middle of a conversation (1)

Sometimes the following trick helps me both code notes (or task lists) and grabs my attention when the ignored task list is floating around on my desk or becomes part of the wad of notes, receipts, and other small pieces of paper that accumulate in my pockets. I review the wad of paper regularly (hopefully finding it before I put the pants or shirt in the laundry and being transformed to lint in the dryer).  This little trick is used by people who make sketchnotes for a living (see the wonderful books by Mike Rohde on sketchnoting). Sketchnoters — because of their business and professional audience — tend to use a more subtle and artistic version of what I do (after all their audience is wearing suits while my audience is me wearing shorts and an old T-shirt). Same principle though.

2014_08_06_09_09_47

[Star Trek may have incorporated the following idea into some of its episodes.]

2014_08_06_09_09_54

2014_08_06_09_10_08

The thick-thin pens are called Fude de Mannen by their manufacturer Sailor and fairly inexpensive. A much more elegant and expensive option that does the same thing is any Sailor fountain pen with a Zoom nib. You can also do the same shift between thick and thin inexpensively with a Noodler’s flex pen or many calligraphy pens (the Japanese ones are best and brush pens work even better) or much more elegantly and expensively with either a Pilot Falcon pen or any Pilot pen equipped with an FA nib. I have no commercial relationship to any of these companies. The odds of finding any of these pens in a brick-and-mortar store in the USA are fairly low but they are available widely on the Internet with many coming directly from Japan (yup, they ship anywhere).

2014_08_06_09_10_01

I use different writing implements to vary things, color code, and even slow myself down (like the decorative fonts do) in order to increase the time for memory encoding, to build in uniqueness that grabs attention, and to amuse myself (I am easy to amuse).

Many of these “tricks” are the same as those as used in mind mapping without the most important feature of structuring, restructuring, and formally associating many ideas.

The next logical step after these kind of notes is mind mapping which I strongly endorse. On the other hand, some people just want to takes notes and may not want to take the time to carefully think through them or organize their thoughts, and for those folks at least remember this.

&&& the purpoSe of noteS is to REmemBER in parT because the noteS are MEMOR(Y)able and you pay more attention to them ***

While I cannot prove this, it is my guess that these techniques will also be useful for those with memory and attention problems like normal aging, cognitive impairment, dementia, Alzheimer’s, and ADHD. But all of these conjectures require empirical research to substantiate and are just WAGs (Wild Ass Guesses) on my part at this time.

Click on the image to expand it.

The Process of Writing in Mind Map


<p>The Process of Writing in “Mind Map” </p>

<pre><code>CART Algorithm
basket of
information
useful
understandable
accessible
broad
general
presentation
communicates
light
humorous
but thorough
framework/model
organized
generalizable
step 1
collect
information
lecture notes
books
research literature
observations
graphics
public domain
proprietary
generated
by you
data
sources
public
web
documents
authoritative
private
proprietary
observations
applications
lecture notes
study
presentations
documentation
“writing”
step 2
assemble
rough outline
1st draft
mind map
documentation
step 4
test

communication
applicability
experts
non-experts
effectiveness
with
target audience
others
guide for
future work
add notes
free-standing
within
mindmap
step 3
rework
reframe
additional drafts
reassemble
2nd drafts
review
repeat as needed
important but often ignored part of process
© 2013-2014 g j huba phd
</code></pre>


I would not write about this topic were I not convinced that a number of government agencies, hackers, and 12 year olds have already thought of this.

Today I was looking at the Mac App Store and saw a new featured program that automatically translates from one language to another. The program reportedly translates 80 languages into 80 languages. Since I do not know 80 (or even 2) languages I have no way of verifying this claim. Nor do I think that there is any problem with this app or others of the type. But the App Store stimulated me to think about something.

What if …

What if I an American security agency (NSA, CIA) wanted to slant American public opinion against the Arab World. It could (probably and extremely rapidly) change the translation dictionaries in a computer program to translate Arabic to English in a tone that subtly makes Arabic statements in public social media seem more aggressive and uncooperative than intended. Or conversely if I were an extremist organization that wished to slant opinion against the United States I might alter a translation dictionary to make English statements sound more negative or aggressive or dictatorial in Arabic. This can be done in any pair of languages in either direction.

I have looked for effective computerized translations to English (or more properly Americanish) for decades, primarily because I have no language skills (or abilities) but want to know what the writers in Arabic, Russian, Spanish, Hebrew, French, Italian, Chinese, Japanese, Korean, and other languages are saying on social media. I try to follow many tweeters in the Arab World because I think that Americans are fairly oblivious to the intellectual and medical advances made there as they also are to the peaceful political and religious views of virtually every practitioner of Islam or resident of an Arab country.

In the era of Twitter and numerous other social media services which are starting to provide automatic translations between languages, who tests to make sure that the auto translations do not intentionally or unintentionally slant public or scientific opinion. Obviously, those most dependent upon those translations are least able to judge this!

Anytime I read something that seems odd from a speaker of another language, I wonder if this is the result of an auto translation program unintentionally or intentionally trying to sway my opinion.

This is perhaps a compelling argument for visual thinking using minimal words.

[On the other hand, there is this Photoshop thing …]

Click on image to expand.

Drum roll please …

Mac Mind Map  App Ratings  June 2014  g j huba phd  ✮✮✮✮✮


Notes

  1. Most other web sites that rank mind map apps carry advertising from at least several different producers of these programs while I do not. This may or may not explain my greater willingness to differentiate sharply between the apps.
  2. Your idea of what a great mind map app should be may differ from mine resulting in different ratings. Mine are particularly relevant for scientific, health, education, and personal use rather than corporate outline formatting. In fact corporate outline formatting in “mind map” programs does not really produce true mind maps, but most corporate customers do not know the difference. Learn why Buzan-style mind maps will perform far better than the “formatted outline” maps produced by many of the best selling programs before committing to one model or the other.
  3. The programs continuously change (most copy each new version of iMindMap after its release) and my ratings change fairly often.
  4. I communicate with some of the app developers (as well as other independent reviewers) via email. I try not to let these interactions with nice people and arrogant people and people with crummy business models (and crummy customer support) and development geniuses color my ratings.
  5. These ratings apply only to Mac software. I do not use any of these programs on a PC. After 25 years of 40-80 hours of PC use per week, I switched to a real computer and use Macs exclusively.
  6. I will release separate ratings for iPad apps, but in general those programs that are especially good on the Mac tend to be especially good on the iPad. Note that while I do not believe that the Mac version of Inspiration is a particularly good app, I think that the iPad implementation is among the very best.
  7. The apps I review are full commercial versions. I have yet to find a free mind map app that is even close to the best paid apps in quality and usability.
  8. Virtually all of the paid apps have free evaluation periods. Most periods are 30 days which is plenty of time to form your own judgment. Make use of the opportunities provided by the developers and vendors.
  9. And yes, the three programs that I intend to use 90% of the time or more are iMindMap, iMindQ, and iThoughtsX. My use is about 85% iMindMap and 2.5% each of the others. I spread the other 10% of my usage around, often experimenting with other programs just to see if they better fit specific uses or types of users.

This mind map that follows is the same as that above reformatted for “3D” presentation.

Mac Mind Map  App Ratings  June 2014  g j huba phd  ✮✮✮✮✮ 3d


I frequently tweet about neurological diseases, sending out links to US government and major foundation web sites. These tweets are among the most retweeted and favorited of those I distribute.

As you may have inferred as you look at the fact sheets distributed, there are commonalities among many of these diseases above and beyond the fact that these are all diseases of the nervous system.

Very few of these diseases have treatments. Most of these diseases are rare and often not detected by primary care physicians or even related specialists like psychiatrists. Medications are frequently used off-label for controlling symptoms like depression, anger, tremor, and many others but these treatments are rarely effective for a long time, if at all, for most patients. Because these are rare diseases and neurological research itself is quite expensive, a small portion of the US medical research budget is spent looking for cures or effective symptom control.

The following mind map shows some of the commonalities among the neurological diseases. Click on the image to expand it.

neurological diseases features common to many conditions

The next mind map is identical to that above. The formatting has been changed so that you (and I) can judge if an alternate format is more useful for certain audiences.

neurological diseases features common to many conditions2

Here is a technique I would try with someone with cognitive impairment. It might also work well with a child, an elder, or anyone else in-between who needs a little help with organization and planning. A caregiver can prepare a mind map or you can prepare one for yourself.

I find the size of standard business envelopes (#10 in the USA) to be just about perfect as a daily information catcher. You can write your schedule on the front and slide the envelope in a pocket, small bag, or the inner pockets of most men’s jackets either unfolded or folded. And since this is an envelope, throughout the day as you pick up receipts, reminder cards for your next appointment with the dentist, a flyer about a concert and all the other little tidbits of life that get lost in your pocket and end up in the clothes washer you can insert them into the envelope and have a good chance of not losing some important information.

Using a mind map instead of a list on the front of the envelope can engage the user, permit color coding, and makes it easier to remember the content.

Takes a couple of minutes.

Yup boss, I have the receipt from lunch.

Notes:

  1. I printed the mind map on an actual business envelope and then scanned it. The green paper was just a background for the scan.
  2. You can use any style you like for the mind map. I chose a font designed for individuals with dyslexia just to illustrate tailoring the content and style of the map to the individual using it.
  3. This mind map was designed in iMindMap. If you wish you can add clipart or photos to the branches; typically I would not just because of the small size of the envelope. Bright colors can substitute for images to engage attention and color code sections.
  4. One can change the map simply by crossing out information that has changed and making notes on the map with a pen.

I think that this can be a very good technique for a paid or family caregiver of someone with cognitive impairment. Prepare the envelope in the morning or preceding evening and go over it with the patient when it will be used (mornings are preferable). I did not put the person’s name on the envelope since the front or inside may contain private information (names of doctors and similar information like medication reminders). I would not put medications in the envelope as they fall out too easily. It may be useful, however, to carry a small amount of paper money in the envelope. Also a standard card with the the caregiver’s first name and telephone-email may prove helpful should there be a health or other problem.

Click the image to expand it.

Scan2014  26


Governments and other public entities are increasing their use of web sites as the primary publication outlet for medical, human services, and research information.

The transition to electronic publication saves money as well as other resources and at the same time is much more environmentally-friendly. At least a few forests in the world owe their lives to the decision of some of the largest paper users in the world to move to electronic publishing.

Electronic publishing offers a special advantage not generally available in traditional publishing on paper. On the Internet it costs no more to include colors, simple and complex images, and images that expand to show greater detail. And it is much less expensive for publications to present, in addition to their traditional text, graphics maximized facilitate creative thinking, memory retention, “big picture thinking,” and explanations that may be easier for individuals using other languages and from other cultures to understand.

Not everyone in the world does their primary thinking using words. Many — including me — find visual information more valuable, easier to assimilate, and more supportive of creative insights.

How often do you see a #MindMap, #ConceptMap, #FlowDiagram, or other visual representation on a government web site? While there are plenty of pie diagrams and line charts, such representations of data are quite limited and do NOT incorporate informed interpretation of information. Also, while there are plenty of pictures on government web sites, these images do NOT incorporate informed interpretation of information and they may give a quite biased view of data.

I do not recall ever seeing a #MindMap, #ConceptMap, or #FlowDiagram on the (otherwise extremely useful and high quality) web sites of the US Social Security Agency, the abstracts in the PubMed medical and scientific information databases, and the US government’s explanations of research and social programs, diseases and social conditions, and social service eligibility forms.

World-wide thinking is increasingly visual. Official information should be presented using both the traditional text-based methods currently employed AND newer, very effective methods of visual thinking. The brain is not limited to a single form of thinking and in fact research shows clearly that some of us (including me) handle visual data far more effectively and perform some of our best work using visual thinking techniques. Research also suggests that as the brain changes through disease processes such as Alzheimer’s disease and other more rare neurodegenerative conditions, as verbal centers suffer damage, visual centers may assume increasing importance.

While I strongly prefer #MindMaps as the method of presenting visual information, I could accept #ConceptMaps, #FlowDiagrams, and other visual thinking representations as at least a first start.

Of the mind mapping methods, I strongly believe that the Buzan-style organic mind maps including color-coding, size-coding, radiant information structures, and methods designed to optimize memory retention, memory retrieval, creativity, and cross-cultural communication are the most effective. A recent addition to mind mapping has been Huba’s method of mind modeling that adds all of the components shown in the figure below.

Click image to expand.

IMPROVING GOVERNMENT INFORMATIONAL WEB SITES

Comedy and tragedy theatrical masks