Info

social, health, political imagery through the lens of G J Huba PhD © 2012-2021

Posts tagged Concept Map

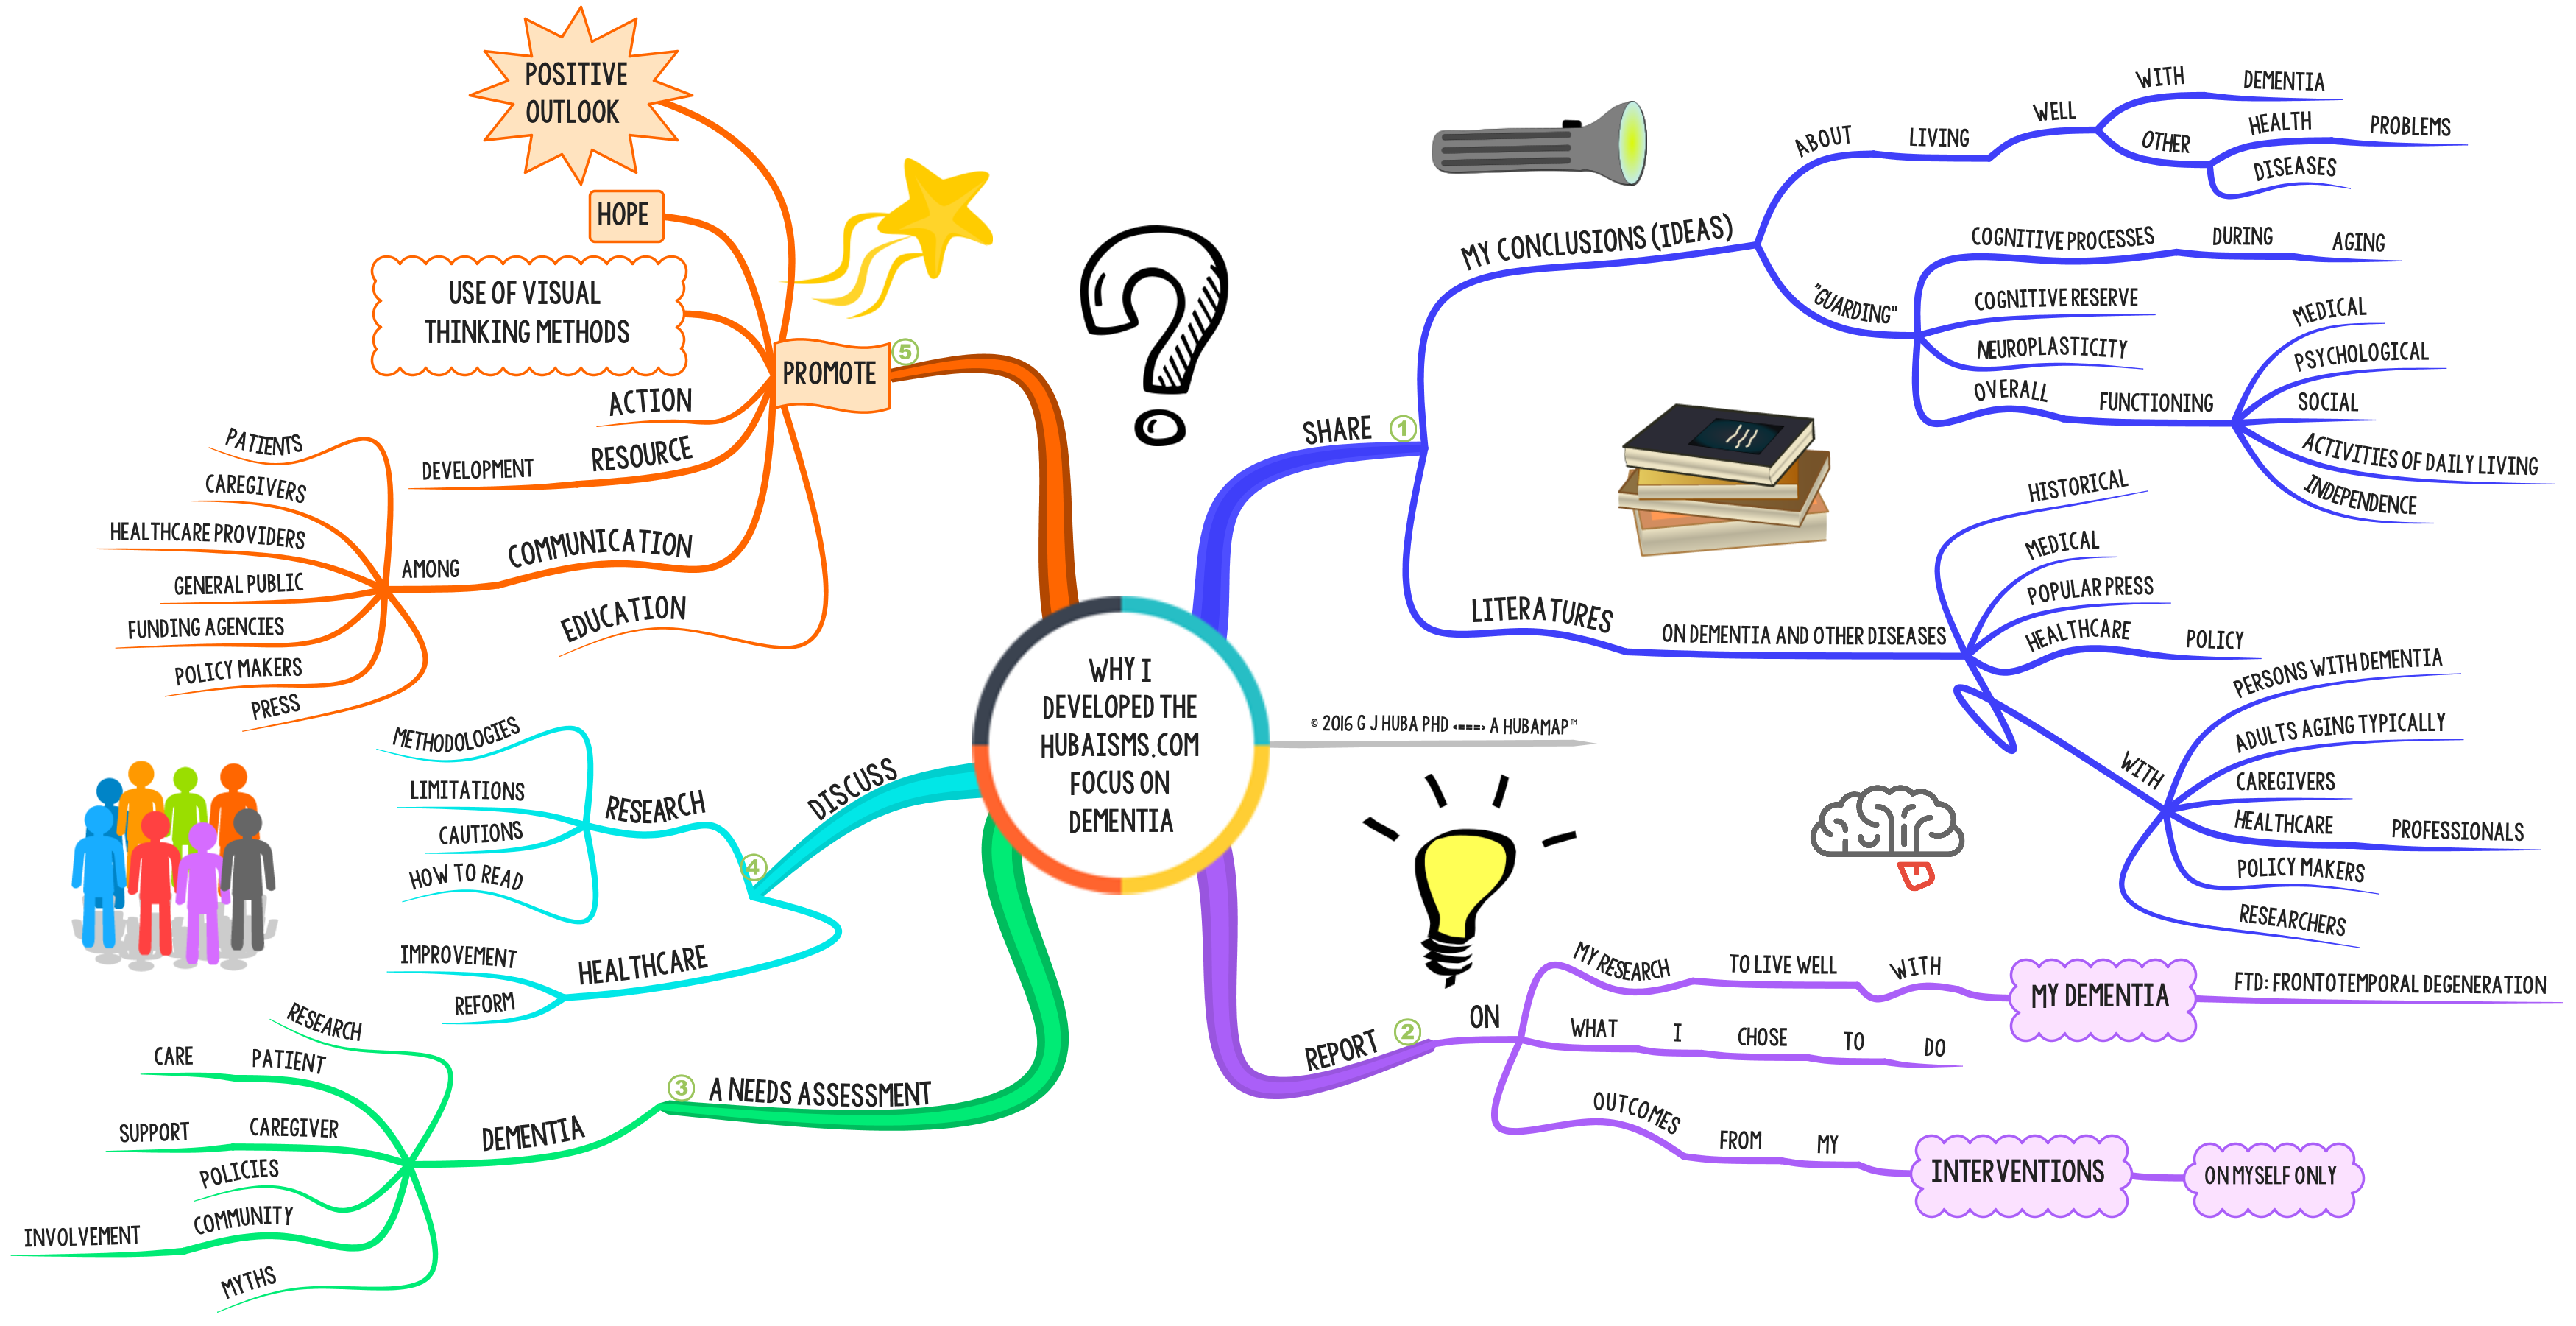
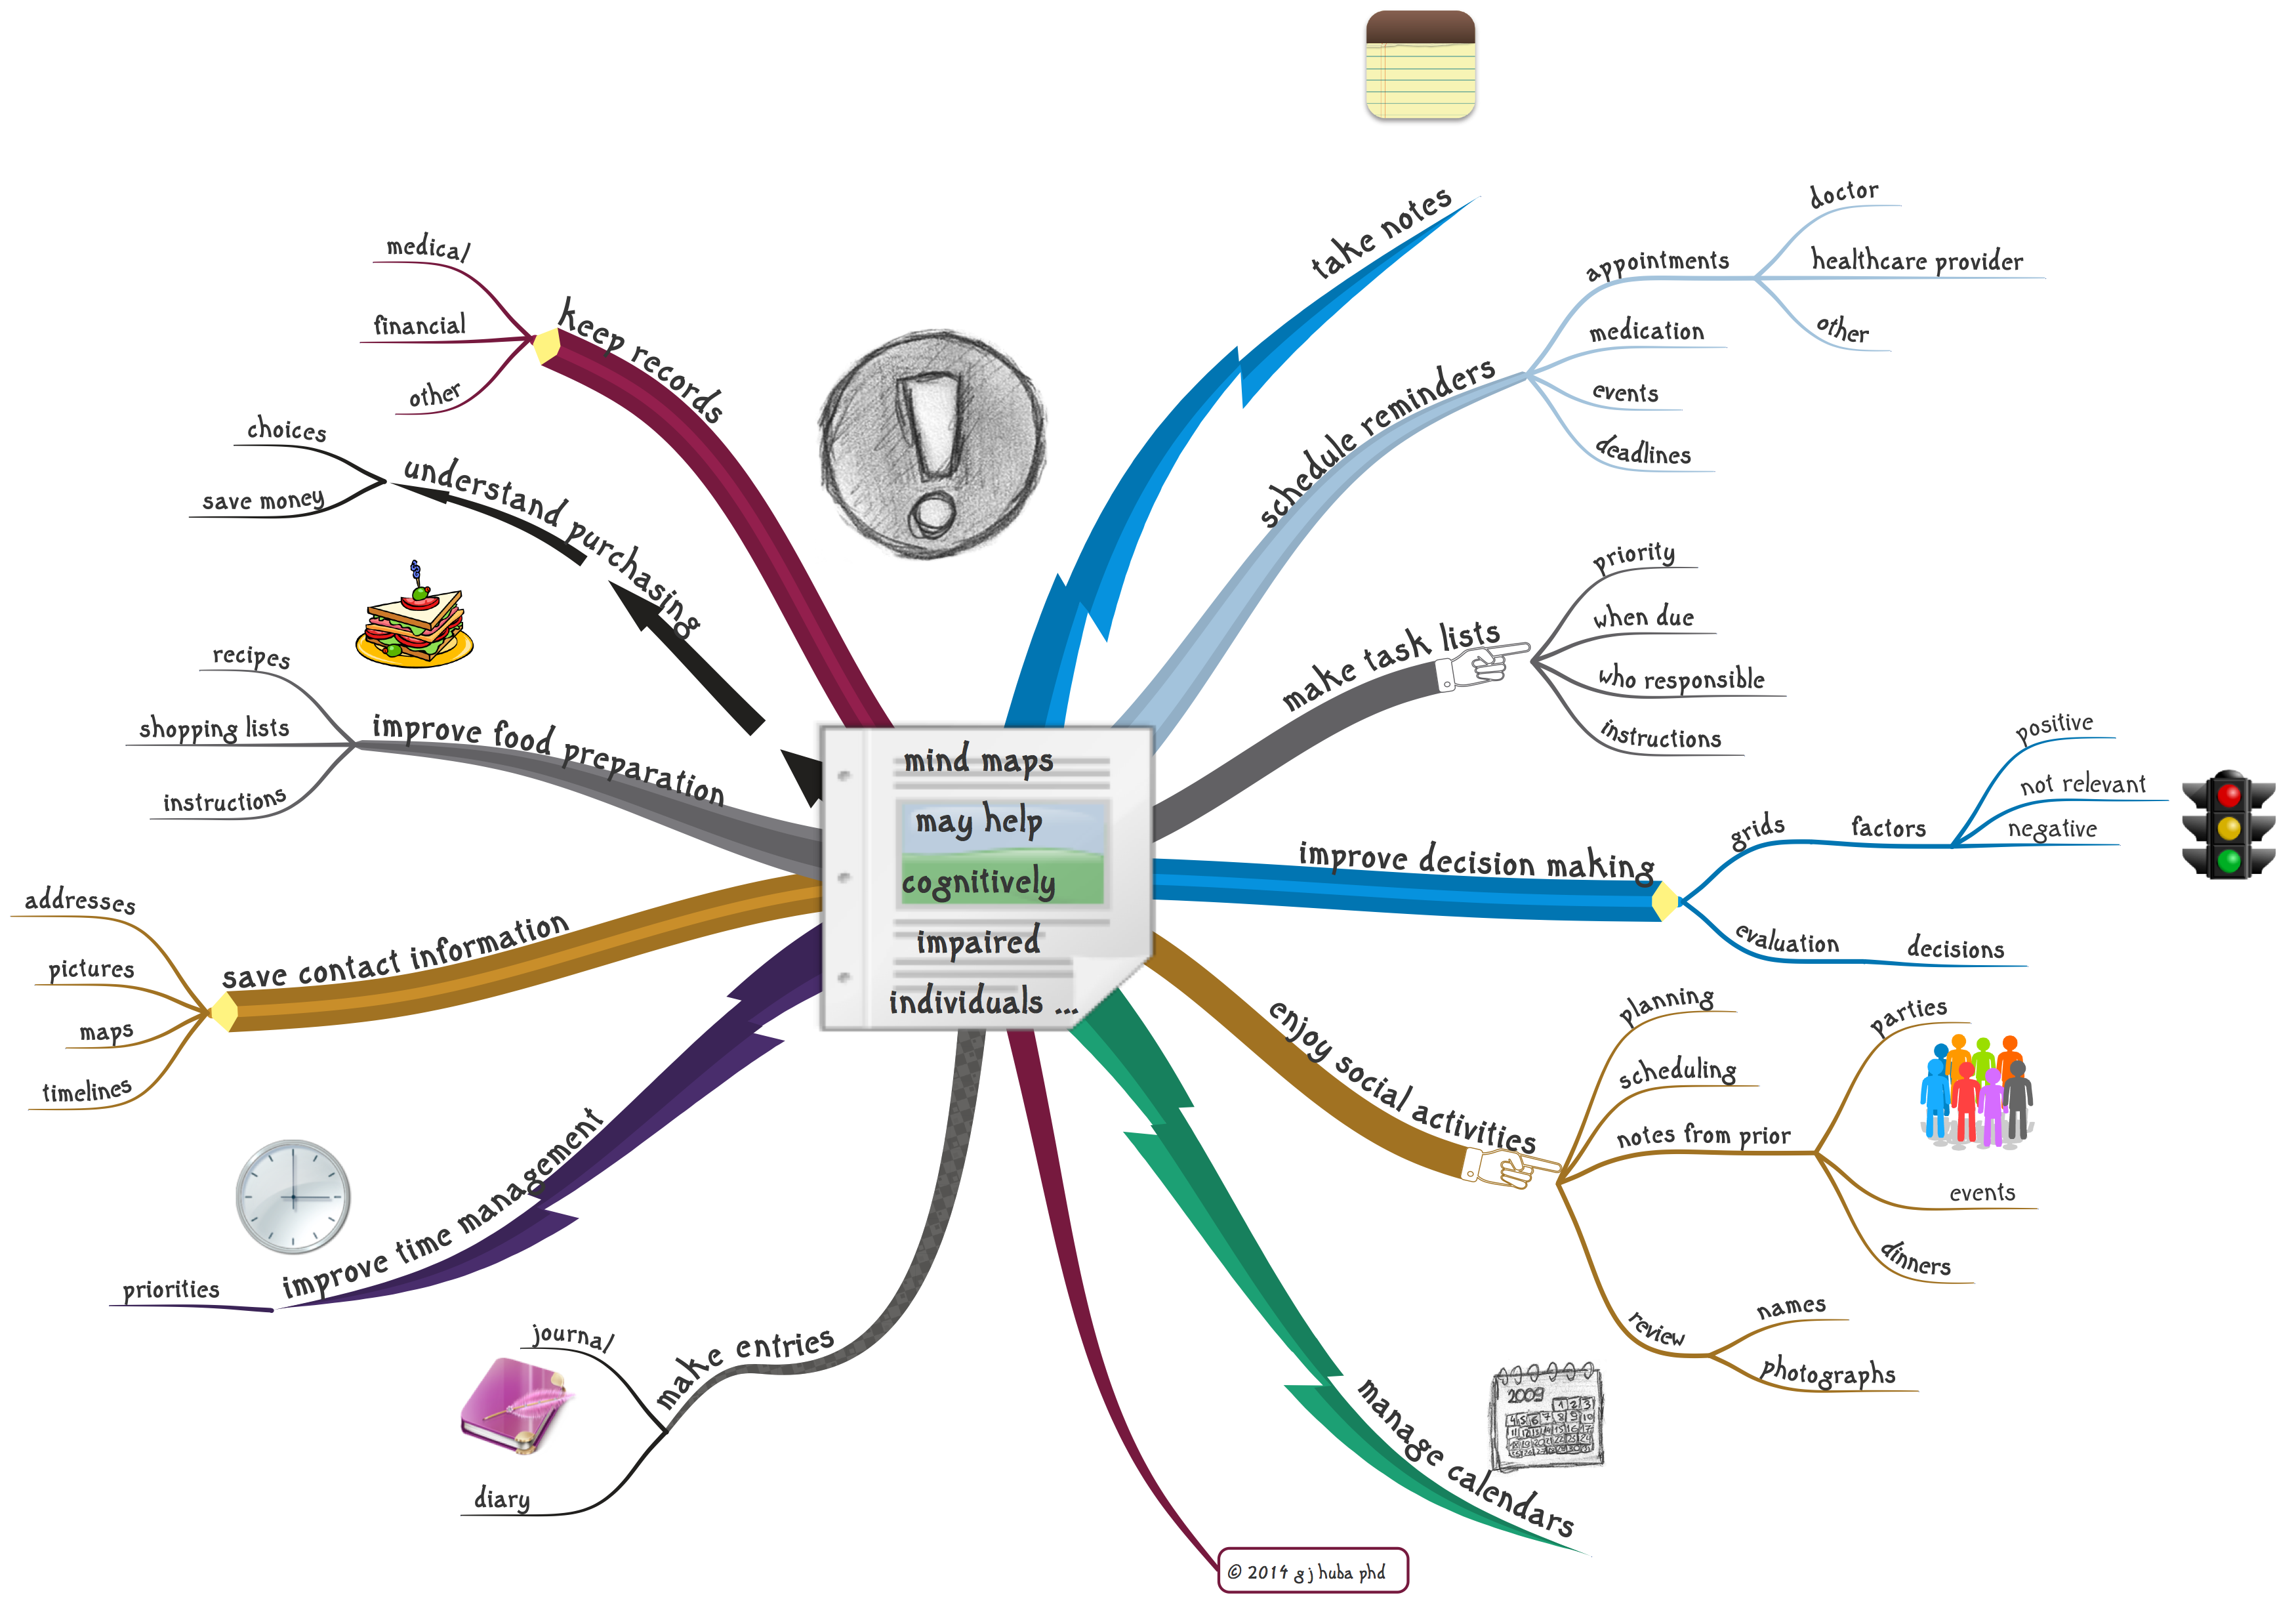
The mind model (aka mind map) below discusses my vision in developing the dementia focus on this website. I started to build the web site about two years after being diagnosed with a neurodegenerative condition (2012). Thus the entire blog is the work of a developer experiencing dementia while designing and preparing the content for the site. The site discusses my progression through cognitive impairment and decline into dementia. More importantly it discusses how I tried to help myself coordinate and use to full advantage the support and professional expertise made available to me by family, friends, the community, my doctors, and the general world-wide of patients and professionals the major issues.

Nothing in this blog post (or any other on blog post or page on the site) is intended to be, or promoted as medical, psychological, or any other form of treatment. The ideas in this blog are about using some commonsense note-taking and visual thinking methods to possible help you live better with dementia. I tried it on myself (only) and I am encouraged although I freely admit that full scientific study is needed.

These methods and comments will not substitute for medical and other professional treatments. They do not cure dementia. They do not slow down the progress of dementia. For me, at least, the methods have sustained and increased my quality of life and I do spend more time with my family and am more independent and in my opinion think better. But my dementia is not being treated and getting better; what I propose are methods that may make it easier to independently manage selected parts of your life, be in a better mood because you are trying to help yourself, be less of a burden to your caregivers, and report better to doctor what your experiences have been since the last appointment.

Many people are miserable almost all days when they have dementia. If simple, inexpensive cognitive tools can improve some or many of those days, the development of such techniques is a huge step forward.

I hope that others will examine the information here and use it to improve the decisions they, their caregivers, and their doctors and nurses must make about their formal medical treatment.

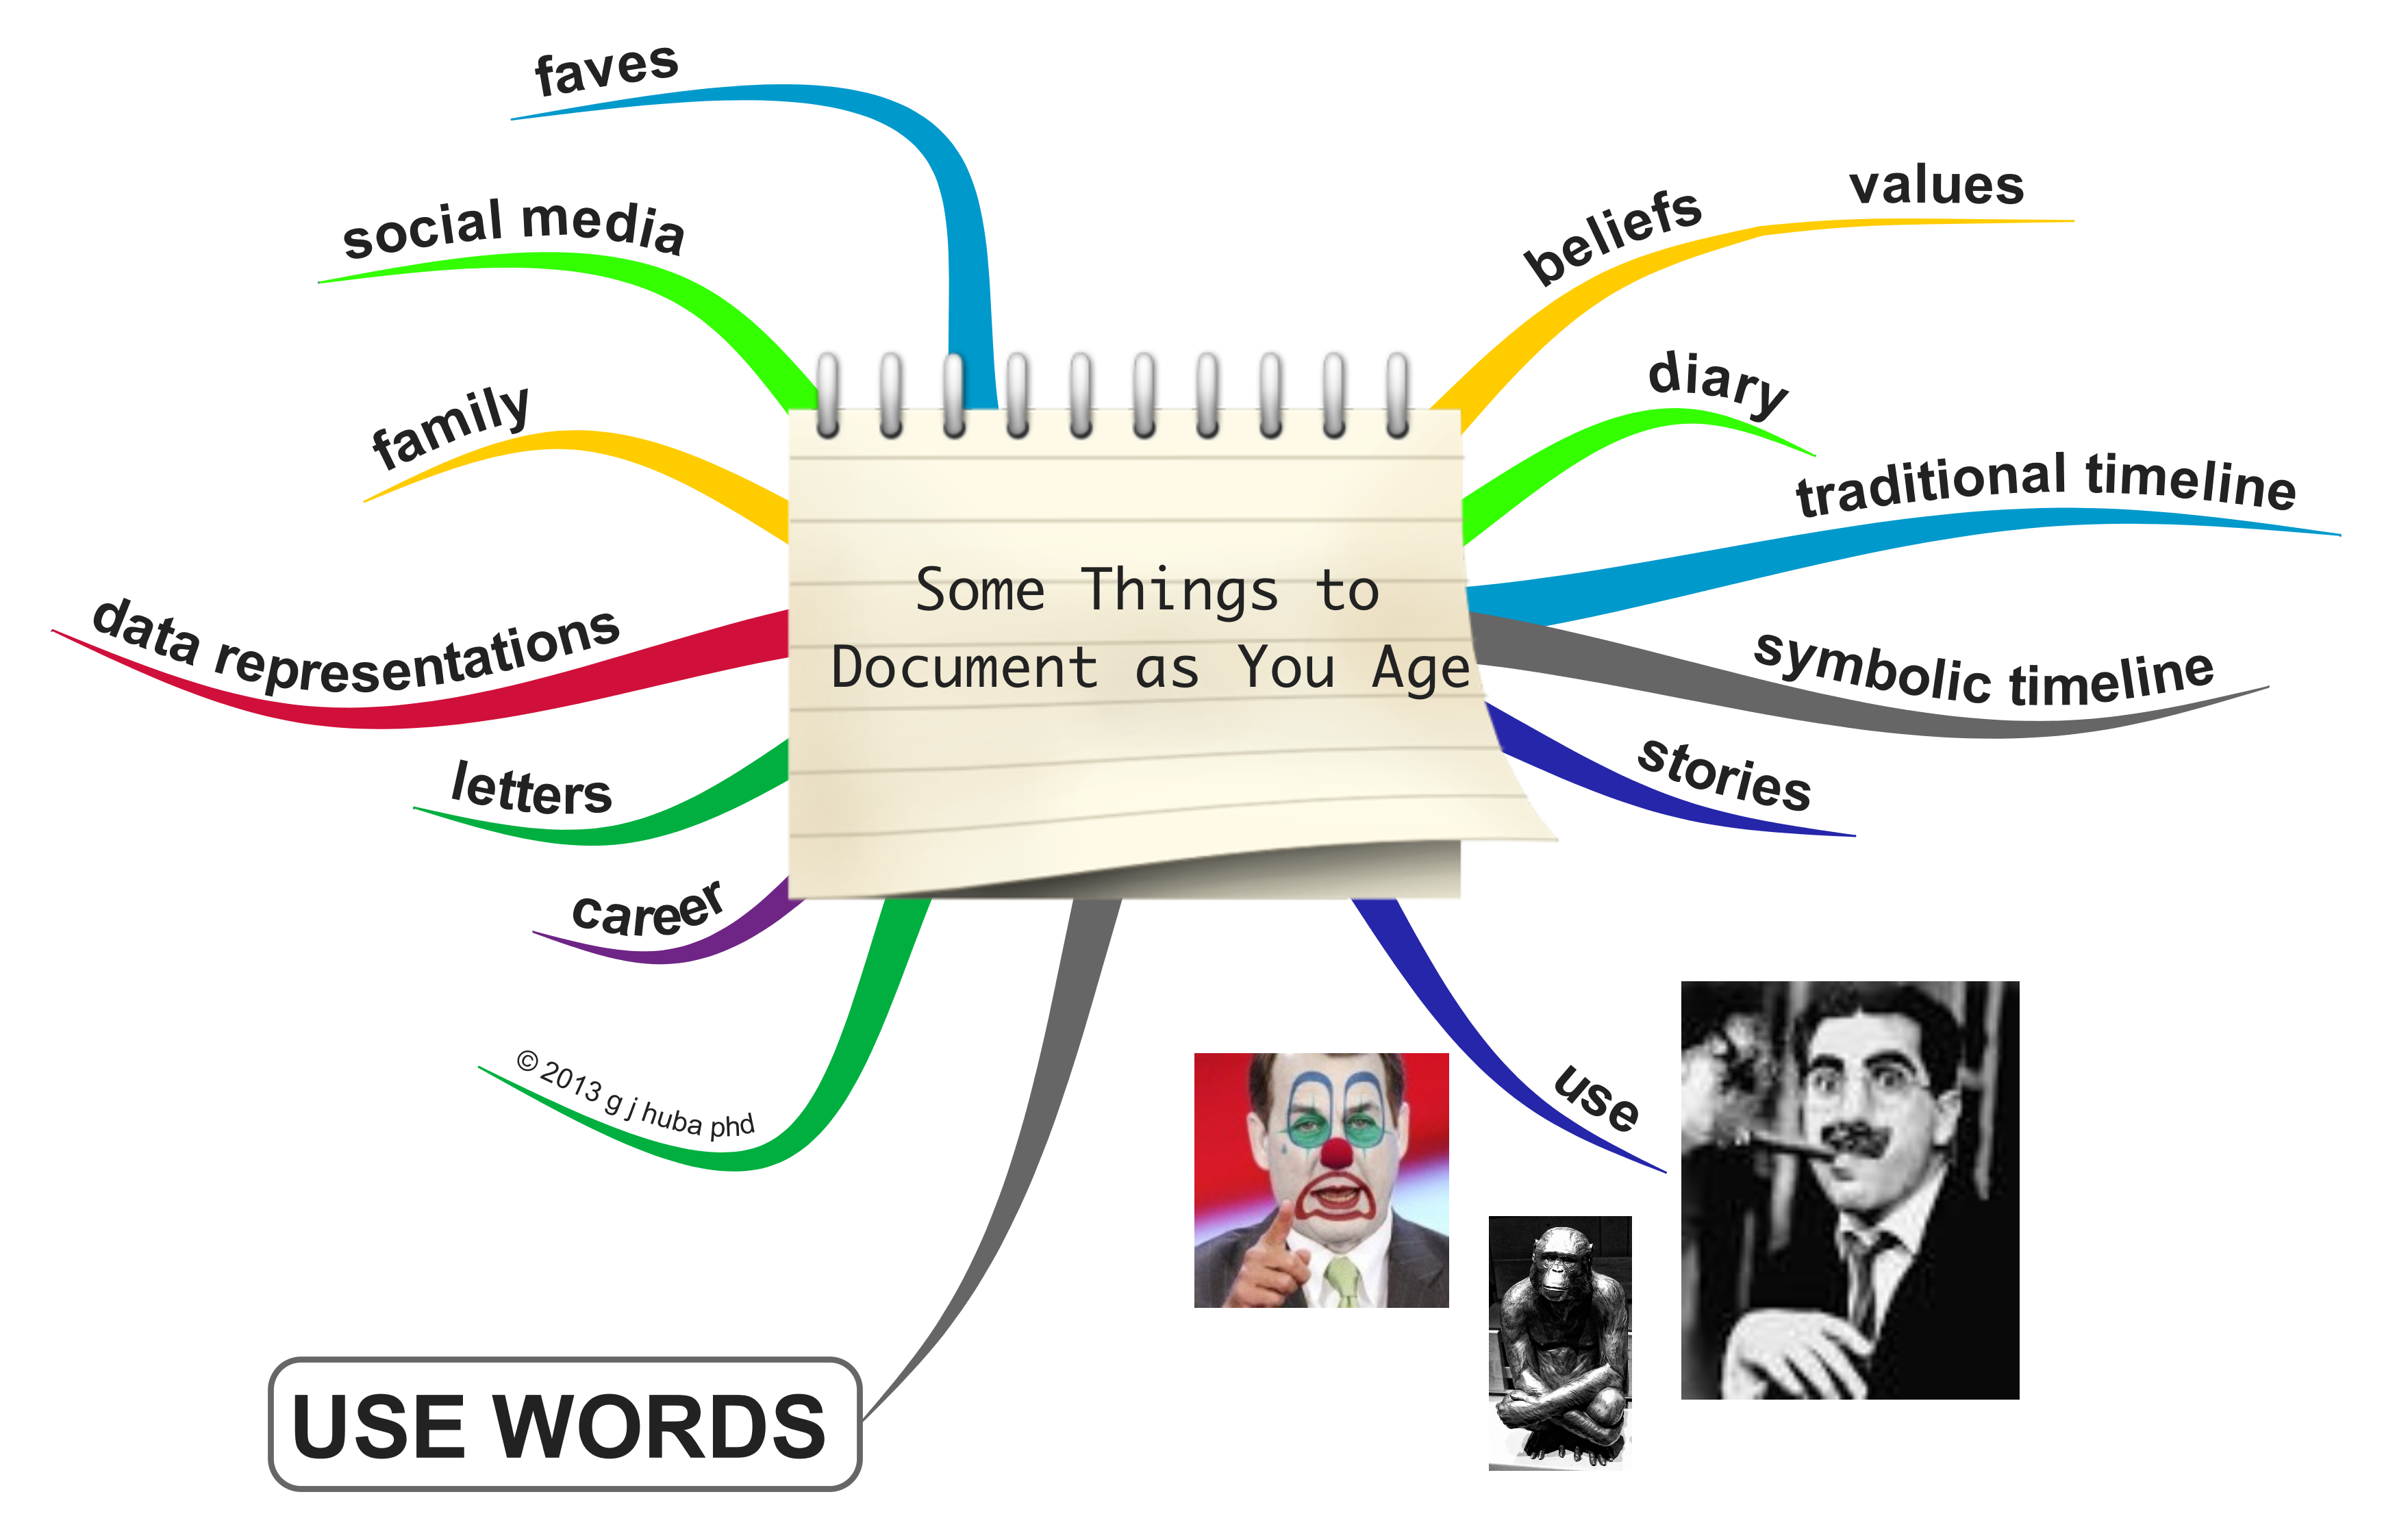
Here is what appears in the blog posts and elsewhere on Hubaisms.com.

Click on the image to expand it.

why-i-developed-the-hubaisms-com-focus-on-dementia

Click here to see Part 2 of My Vision in a separate window.

still-crazy-after-all-these-years

I have been a HUGE fan of the Olympics since I was a very little kid. In 1984 I got to go to the Olympic events in Los Angeles every day for two weeks, on many days with my father. That was the year that the Soviet Union boycotted the games because the USA had boycotted the Moscow Olympics in 1980. Heck, I thought it was great — the USA and East Germany (who came) won all of the gold medals! Months earlier when local pundits in Los Angeles said Los Angelenos were too apathetic to purchase expensive Olympic tickets especially with the Soviets and most of the Eastern Bloc boycotting as it would not be a real sporting event, I had bought as many tickets for the “finals” as I could get my hands on. Later I sold the extra tickets as Los Angeles fell in love with the games. I made so much money that the expensive tickets I had bought for the entire family of 7 that we used ended up were effectively free since the profits covered the cost of the tickets we used. Street enterprise at its best. My tickets became worth more because the Soviets didn’t come as all Americans became Olympic fans the year we won all the golds.

Winning the race to live well with dementia is like running the 10K race at the Olympics. Everybody has to pace themselves at the beginning so that they can learn about their opponents. In the final stages of the race they speed up and sprint their fasted the last 200 meters.

A mind model of the dementia race strategy is shown below. Click the image to expand it.

I think I am winning my race to live life to its fullest while having dementia. I’m getting ready to claim that gold medal. You can win your race too. Think about what you are doing and strategize like a 10K runner. Learn all you can in the beginning and then speed up later as your new knowledge kicks in.

race-2-bigger


3d-race


Blockheads-23


Since the beginning of this blog in 2012, I have consistently — with each new version — concluded (from dozens of comparisons with other programs) that iMindMap is the single best program for developing mind maps. Period.

With version 8.0, iMindMap is no longer the world’s best mind mapping program. Rather, it is the world’s best mind mapping program PLUS additional features that make it the world’s best visual thinking environment (or VITHEN using my coined term). Period.

What makes iMindMap 8.0 so valuable as an overall mind mapping and visual thinking tool is that it encourages you to use iterative, hierarchical, nonlinear, big-picture, creative ways of generating ideas, communicating those ideas, and integrating the ideas with the data of images and statistics. There is no tool I know of that is better for these overall tasks and the building of creative models.

I use iMindMap between 3 and 10 hours per day on the Mac, iPad, and iPhone 6 Plus.

Version 8 exceeds Version 7 in that the program has been significantly speeded up both for computer processing and in general usability of all of its advanced formatting features. The increased speed with which advanced formatting can be done encourages more precise and creative visual thinking.

Did I mention it has a very good (becoming excellent) 3 dimensional display mode and provides a much better presentation tool than the PowerPoint standard? The new Brainstorming Mode (file cards on a corkboard metaphor) allows those who like to see words rather than images to brainstorm in the mode most natural to them. I’ll never use the mode but I project many will embrace it.

The iMindMap program has been the best tool I have had to allow me deal with a neurocognitive neurodegenerative disorder and continue to be productive over the past five years. The program permits me to think at a very high level which I cannot do nearly as well with other techniques or other mind mapping programs.

All seven maps shown here are identical except for their format.

[I intentionally did not use any clipart because I did not want distract from the basic creative thinking and model development-presentation functions of iMindMap that are the real core of the program. With any of the variations of this map, if you spend 10 minutes adding selected included clipart or icons, the map will be even more visual.]

The remainder of my review is — appropriately — presented as a mind map.

Click images to expand.

Three styles provided with the iMindMap program.

1iMindMap 8.02iMindMap 8.03iMindMap 8.0


4 Custom Styles I Use in My Own Work and 4 Variations on the Same 3D Mind Map

gh1Imindmap 8.0gh2Imindmap 8.0gh3Imindmap 8.0gh4Imindmap 8.0

Imindmap 8.0 3D4Imindmap 8.0 3D3Imindmap 8.0 3d2Imindmap 8.0 3D


bolero cover 3 parts FINAL


The majority of the posts on this blog are about using visual thinking methods — of which I think that by far the best is #Buzan-style organic mind mapping — to understand, explain, evaluate, and communicate about healthcare. A lot of my own thinking has focused on using visual thinking techniques to potentially improve the quality of life of those with cognitive impairment and dementia.

Tony Buzan and Chris Griffiths and their colleagues and staff at ThinkBuzan have done a very comprehensive job at getting many of Buzan’s ideas embedded into a general purpose computer program (iMindMap) which provides a general visual thinking environment, of which mind mapping is a special part. There are many computer assisted mind mapping programs, but I have concluded that iMindMap is by far the best for creative visual thinking and communication, in no small part because it fully incorporates Buzan’s theory and theoretical implementation.

Like scientists and management consultants and educators and healthcare providers and patients and patient caregivers and students and many others, illustrators struggle with how to best use visual representations to support better thinking and communications.

Which brings up this beautifully conceived and executed little book that I have found to be mind expanding and liberating in how to develop and use a series of illustration techniques and “tricks” to look at things differently when trying to make creative breakthroughs.

Whitney Sherman is the author of the book “Playing with Sketches” which provides 50 exercises which collectively will change the way you think about creating images to understand and communicate ideas.While Ms. Sherman wrote the book for designers and artists, the techniques will be just as useful for visual thinkers in science, education, medicine, industry, and other fields. The beauty of Ms Sherman’s exercises is that in showing you fairly simple ways to make hugely informative and well designed images, the tools will themselves suggest many applications to visual thinkers of all types.

And, I have found that Ms. Sherman’s techniques can be used by the severely artistically challenged (of which I am one); the techniques are ones for Visual THINKERS, not necessarily artists and designers.

I have mentioned this book before in much less detail, but in the months I have used the methods, I have found that they WORK very well to facilitate creative visual thinking. For me they have promoted a breakthrough in how I see the visual thinking canvas.

Get the book, try some of the techniques (pick a random one here and there to start), discover that great artistic talent or aptitude is not required, and see how the techniques fit the information you study in search for better healthcare or disease prevention or decision making or facilitating creative group processes.

In partnership with Tony Buzan’s techniques for organic #mindmapping and Mike Rohde’s framework for #sketchnoting, the techniques codified by Whitney Sherman provide very powerful visual thinking tools.

Ms. Sherman’s website is http://www.whitneysherman.com. She tweets at @Whitney_Sherman. The book is available from major online book sellers.

2014-10-26_21-24-51


I will be posting some examples of using the sketching techniques of Ms. Sherman to developing assistance and communication techniques for those with cognitive impairment or early-mid stages of dementia.

2014_10_27_08_51_03


2014_10_27_08_51_05


Click on image to expand.

Drum roll please …

Mac Mind Map  App Ratings  June 2014  g j huba phd  ✮✮✮✮✮


Notes

  1. Most other web sites that rank mind map apps carry advertising from at least several different producers of these programs while I do not. This may or may not explain my greater willingness to differentiate sharply between the apps.
  2. Your idea of what a great mind map app should be may differ from mine resulting in different ratings. Mine are particularly relevant for scientific, health, education, and personal use rather than corporate outline formatting. In fact corporate outline formatting in “mind map” programs does not really produce true mind maps, but most corporate customers do not know the difference. Learn why Buzan-style mind maps will perform far better than the “formatted outline” maps produced by many of the best selling programs before committing to one model or the other.
  3. The programs continuously change (most copy each new version of iMindMap after its release) and my ratings change fairly often.
  4. I communicate with some of the app developers (as well as other independent reviewers) via email. I try not to let these interactions with nice people and arrogant people and people with crummy business models (and crummy customer support) and development geniuses color my ratings.
  5. These ratings apply only to Mac software. I do not use any of these programs on a PC. After 25 years of 40-80 hours of PC use per week, I switched to a real computer and use Macs exclusively.
  6. I will release separate ratings for iPad apps, but in general those programs that are especially good on the Mac tend to be especially good on the iPad. Note that while I do not believe that the Mac version of Inspiration is a particularly good app, I think that the iPad implementation is among the very best.
  7. The apps I review are full commercial versions. I have yet to find a free mind map app that is even close to the best paid apps in quality and usability.
  8. Virtually all of the paid apps have free evaluation periods. Most periods are 30 days which is plenty of time to form your own judgment. Make use of the opportunities provided by the developers and vendors.
  9. And yes, the three programs that I intend to use 90% of the time or more are iMindMap, iMindQ, and iThoughtsX. My use is about 85% iMindMap and 2.5% each of the others. I spread the other 10% of my usage around, often experimenting with other programs just to see if they better fit specific uses or types of users.

This mind map that follows is the same as that above reformatted for “3D” presentation.

Mac Mind Map  App Ratings  June 2014  g j huba phd  ✮✮✮✮✮ 3d


Governments and other public entities are increasing their use of web sites as the primary publication outlet for medical, human services, and research information.

The transition to electronic publication saves money as well as other resources and at the same time is much more environmentally-friendly. At least a few forests in the world owe their lives to the decision of some of the largest paper users in the world to move to electronic publishing.

Electronic publishing offers a special advantage not generally available in traditional publishing on paper. On the Internet it costs no more to include colors, simple and complex images, and images that expand to show greater detail. And it is much less expensive for publications to present, in addition to their traditional text, graphics maximized facilitate creative thinking, memory retention, “big picture thinking,” and explanations that may be easier for individuals using other languages and from other cultures to understand.

Not everyone in the world does their primary thinking using words. Many — including me — find visual information more valuable, easier to assimilate, and more supportive of creative insights.

How often do you see a #MindMap, #ConceptMap, #FlowDiagram, or other visual representation on a government web site? While there are plenty of pie diagrams and line charts, such representations of data are quite limited and do NOT incorporate informed interpretation of information. Also, while there are plenty of pictures on government web sites, these images do NOT incorporate informed interpretation of information and they may give a quite biased view of data.

I do not recall ever seeing a #MindMap, #ConceptMap, or #FlowDiagram on the (otherwise extremely useful and high quality) web sites of the US Social Security Agency, the abstracts in the PubMed medical and scientific information databases, and the US government’s explanations of research and social programs, diseases and social conditions, and social service eligibility forms.

World-wide thinking is increasingly visual. Official information should be presented using both the traditional text-based methods currently employed AND newer, very effective methods of visual thinking. The brain is not limited to a single form of thinking and in fact research shows clearly that some of us (including me) handle visual data far more effectively and perform some of our best work using visual thinking techniques. Research also suggests that as the brain changes through disease processes such as Alzheimer’s disease and other more rare neurodegenerative conditions, as verbal centers suffer damage, visual centers may assume increasing importance.

While I strongly prefer #MindMaps as the method of presenting visual information, I could accept #ConceptMaps, #FlowDiagrams, and other visual thinking representations as at least a first start.

Of the mind mapping methods, I strongly believe that the Buzan-style organic mind maps including color-coding, size-coding, radiant information structures, and methods designed to optimize memory retention, memory retrieval, creativity, and cross-cultural communication are the most effective. A recent addition to mind mapping has been Huba’s method of mind modeling that adds all of the components shown in the figure below.

Click image to expand.

IMPROVING GOVERNMENT INFORMATIONAL WEB SITES

Comedy and tragedy theatrical masks

For researching, conceptualizing, evaluating, designing, and communicating I prefer to use a VIsual THinking ENvironment or #VITHEN.

There are three tools I use most on my Mac TOGETHER as a visual thinking environment. My preferred programs are iMindMap, Scapple, and Big Hairy Goal. I would rank them 1, 2.5, and 2.5 respectively.

Note that I do not use these three programs alone and on many project use iMindMap plus (Scapple or Big Hairy Goal). Combined these three programs provide an excellent VITHEN. If you only want to work with one program, use iMindMap, the premier and most comprehensive product in this space.

And, yes I coined the term VITHEN.

Click on image to expand.   VITHEN   #iMindMap, #Scapple, #BigHairyGoal, #VITHEN

If you read this blog regularly you know that I experiment a lot with mind mapping methods and try to analyze how they might be best used to promote active visual learning.

It all really comes down to one conclusion — mind mapping methods help you think better. And active thinking is part of the “real” definition of mind mapping.

A few thoughts. Click on the image to expand.

Image

The first version was published a few posts ago and created in iMindMap 6. The original post has a discussion of the highly credible web sites from which the information in the map was developed.

10 Warning Signs of Alzheimer's Disease

This second version was created by reformatting the first using some new tools available in iMindMap 7 and capitalizing on the improvements in speed and ease-of-use of tools that had been available in iMindMap 6, but in a more primitive way. In particular, it is now much easier to work with text meaning that pulling text into positions on the canvas ringing the map may be a good way to store data related to the conclusions embedded within the mind map.

I7 10 Warning Signs of Alzheimer's Disease.imx

As of last week, iMindMap 6.2 was the best mind mapping program available from any vendor. As of this week iMindMap 7.0 has blown 6.2 away, making a huge leap forward. The gap between iMindMap and the other mind mapping programs on the market has widened considerably.

iMindMap 7 is much more than a mind mapping program but rather a visual thinking/teaching tool and environment, within which mind maps are a large, but certainly not the only, component. In addition to the best mind maps available, the program can produce flow diagrams, path diagrams, concept maps, visual notes (like sketch notes), and combinations of all of the above.

iMindMap 7 is a visual thinking tool for a complete visual thinking environment. The app expands upon the mind mapping theory of Buzan and presents a much more elaborated environment for visual thinking and visual concept development than has been available before. And, just as importantly, to use apply this theory and use the tools of iMindMap 7 you need not be a “computer wizard,” “a professional mind mapper,” or a long time user of earlier programs and visual thinking theories.

I see the release of this program as the beginning of a period in which visual thinking and visual communication becomes even more important and used. Tony Buzan and Chris Griffiths have done a spectacular job in getting the theory and implementation so far along this path already. I hope they release a new book shortly.

Click the image below to expand and see my formal review. Note that I probably used less than 60 percent of the features of the program in the review map, and there is a lot more to explore in subsequent posts with differing types of information.

iMindMap 7  initial review final

Oh, did I mention that iMindMap has a “presentation mode” which makes PowerPoint obsolete. Here is a video of the review above running in an automatic kiosk mode. There are a number of options for the presentations that can be applied depending upon the type of audience and the map content. And it can be presented in 3D which I chose to do. [For this example, a tiny file size with low resolution optimized for the web was used because the intent is simply to illustrate the feature, not crash the server. Note also that the low resolution does de-emphasize the 3D effect; 3D looks extremely good at HD resolutions. I also included a HD version which may give some servers trouble. Both presentations have the same content.] Click below to start the video (about 3 minutes).

low resolution

high resolution

If you don’t like the timing of the slides or the type of transition or the order, you can easily change these settings and reload the video.

[Footnote: I started programming mathematical algorithms in FORTRAN in 1970, published my first of several computer programs in peer-reviewed journals in 1973, and published an early mathematical algorithm and FORTRAN program in 1984 that was a precursor of what are now called concept maps (under the rubric in statistics of “path diagram” or “structural equations model”). Between 1977 and 1984 I published a large series of “visual mathematical models” of drug abuse etiologies and consequences using the LISREL programming environment. In comparison to all of my former experience with computer usage in real-world applications, this is the finest software application I have used in the 40+ years of my career. I am delighted I have the opportunity to use this app to explain some of my ideas and create new ones.]

This post does not contain medical advice. None of the methods described are known to be therapeutic. What is described are possible note-taking or information-sharing models for patient-client-self management.

For the past few months, I have been focusing on the use of mind maps to assist people with dementia, cognitive impairment, or cognitive decline deal with various issues that arise as they work hard to maintain independence.

You can access those posts simply by using the search box at the bottom of each post with keywords like “dementia” or “cognitive.” Several dozen blog posts will pop up with most very recent.

But the reality is that as dementia or other cognitive problems progress, many patients will require increasing amounts of supervision and care. Mind maps may prove to be useful in assisting a caregiver to help in a more effective, and cost–effective, manner.

  1. Just as those with cognitive decline may be able to remember, plan, express themselves, and document their lives in maps, caregivers may be able to use these techniques themselves to provide better care and client management. Mind maps may potentially help the caregiver recall the preferences of the client, as well as the client’s life history, important events, significant people, and life style
  2. Caregivers may find that visual information recorded in mind maps provides a good way for the caregiver and the client to start discussions.
  3. Caregivers may find that clients can express themselves better with pictures, drawings, doodles than in words.
  4. Caregivers may find that their own notes from each day are more useful if captured in the format of mind maps.
  5. Caregivers may find that mind maps may be used for brainstorming by themselves, with healthcare providers, with family members, and with the client ways to organize daily events, select food and clothing, remember medications, and organize social events.
  6. Caregivers may find it useful to record their own feelings in mind maps as a way of dealing with the emotional and physical stress of caregiving.
  7. The daily calendar — including doctor visits and other appointments and visitors — may be easier to prepare as a mind map and much more useful to the client.

There are dozens of other ways mind maps might be useful in caregiving. I am going to write many posts on this topic in the next months. For now, here are a few examples with many more to come.

Click on each of the images to expand it.

Preparing a Mind Map (with the help of the client or family members) of the Client’s Preferences.

Preferences  Hypothetical  Individual

***

Preparing a Mind Map (with the help of the client or family members) of the Client’s Religious Beliefs.

Religious Beliefs

***

Preparing a Mind Map (with the help of the client or family members) of Things the Client Especially Enjoys.

SPECIAL TREATS

***

Preparing Mind Maps from the Warning Brochure that Comes with Each Prescription Refill.

possible  side effects winter

OR

SEg

***

Preparing a Mind Map of Each Day for Your Use and That of the Client.

Today  Tuesday  November 12

***

Technical notes. The sample mind maps here were all prepared in the computer program iMindMap, which I strongly prefer both for the way it facilitates mapping and the way it typically produces maps that can be very useful. There are alternate programs that can be used, although perhaps not with the same level of good results possible with iMindMap. Because the maps will be used by caregivers and clients, they will tend to be most effective if colorful, “bold,” graphically interesting, and with large typefaces all of which are easily done in iMindMap. Acceptable alternatives to iMindMap would be iThoughts, Inspiration on the iPad (but not on the PC or Mac), MindNode, and XMIND, although each of the alternatives will be more difficult to use to produce maps for clients with cognitive decline than is iMindMap. There are free mind map programs available or free demo versions. This is a case, however, where paid versions are far more cost-effective than the free versions or most free programs. There is a second type of mind mapping program more suitable for business purposes (the major one is MindJet MindManager and also MindDomo and MindMeister) than those caregiving applications discussed here.

The only way I see to develop effective medical treatments and care models for many of the thousands of rare diseases is to pool the RESEARCH resources that individual countries are spending and the data countries are collecting about individual rare diseases and put those research resources under international control for prioritizing research agenda and ensuring public access to ALL results and research data.

Yes, I know the USA (probably the largest resource contributor) Congress will go in front of the television cameras and say that the failure of the United Nations and the disproportionate contributions to a pooled resource fund will ensure failure. They will point to the failure of the world to effectively coordinate collaborative research on HIV/AIDS and point to politics, homophobia, disrespect, and the hatred of American politics by certain national and fundamentalist groups and say we would be wasting our money by letting Africans and Arabs and the Russians and Chinese and Indians and Asians and South Americans collaborate with the USA on research and ensuring that research leads to effective treatments for at least some rare diseases.

Enough already. Let’s rise to the occasion of solving resource limitations in studying rare diseases and get an effective mechanism in place for expanding the impact of admittedly small research efforts by individual countries through international cooperation. I trust the governments of the world to collaborate, contribute as they can, and help us start to get some of these diseases treatable. Disease knows no boundaries.

In the last century we collectively developed very advanced medical research techniques. In this century we need to use these methods to solve all of the medical problems possible by putting aside the nonsense politics and nationalism and individual egos and predatory profits and focus on solving many medical issues and ensuring access to effective treatment world wide.

Here’s a way to start. Any yes, this is a test of our humanity and commitment to universal human rights of which medical treatment is but one. But let’s start somewhere that should be relatively easy to agree on (and let a few hundred angry politicians in the USA know that the world considers them bratty children and cannot tolerate their obstructionist and oppositional behavior).

Click on the image to expand. And let’s start the process of collaboration.

rare diseases time for effective international cooperation

EU rare disease rare disease

Here are links to some earlier posts about events, people, reactions, and other information you might wish to document as you age so that you (or a caregiver or younger family member) will have the information later. Each of these posts illustrates combining text and images. These examples are ones that can be done by you before you have any cognitive problems as a self history as well as with a caregiver after problems occur. Any whether you ever need to use to help you if there is a cognitive decline, these are great ways of passing down information from generation. I wish I knew much of this information about my parents and other family members. Click on links to see examples.

Beliefs and Values

Diary

Traditional Timeline

Symbolic Timeline

Stories

Letters

Data Visualizations

Career in Perspective

Social Media

Favorites

Some Things to Document as You Age

As is said (albeit in a quite different context) “use it or lose it.”

You age and people tell you to start doing crossword puzzles (I’ve never liked them) or to do simple arithmetic on an iPad (hhmmm… I prefer advanced mathematics) or to get your pictures together in a box (I prefer slide shows from a high-end photo processing app).

Use it or lose it.

Why start doing baby mental exercises as you get older? Why not use a better way of organizing information, planning, making decisions, and actively thinking about things around you, your life, or advancing a new intellectual hobby (mine are visual thinking research and great mandolin and ukulele players of the world)?

Use it or lose it.

Many people look at mind maps and think they are pretty pictures or formatted outlines. In fact many so-called “mind mappers” pass off work that is not mind mapping as mind mapping.

One of the most frequently ignored or missed parts of Tony Buzan’s seminal writings on mind mapping is that mind mapping requires active thinking. It is not a passive process of formatting an outline of the same-old, same-old, same-old information.

Mind mapping is really a combination of using the pretty tools in mind mapping programs to facilitate active thinking about something and to develop actively a summary model of how all the thoughts go together.

Do you think active learning through mind mapping is a better way of thinking that for many older adults is new and novel and might be a way to “use it and not lose it?”

I think so. Use it and don’t lose it.

An example. Click on image to expand.

3G Organized Thinking with Mind Maps

*********

Also see, “Running Away to the Circus”

Also see “Cognitive and Behavioral Tools for Dealing with Cognitive Decline: A #MindMap”

Very useful for forms, templates, novelty, and kidz. Example done with #imindmap on an iPad. Click on image to enlarge.

Computer Assisted Mind Mapping with Handwritten Labels

Steps to hand label the parts of the mind map (in iMindMap)

  1. make a branch without a label
  2. click on the branch to open the drawing app
  3. write/print the word and click done
  4. when back to main mind map window, click drawing, make bigger, rotate as required
  5. tweak the branch by curling it around the handwritten label

Sept 9 2013: Since this was posted, Hans Buskes has also demonstrated the technique of using handwriting in his incomparable way. And he graciously dedicated the map about iOS 7 to me! [Now if only Dr Buskes’ endorsement would let me get on the Apple web site to download iOS 7!]

This mind map was originally prepared in MindManager in the late 2001 for an evaluation of an initiative to increase the capacity of US Nursing Schools to meet the need for graduate-trained gerontological/geriatric nurses. I spent 10 minutes running the original file through iThoughtsX to add some color hues.

This was an evaluation of an important initiative funded by the John A Hartford Foundation (Building Academic Geriatric Nursing Capacity).

Click on the image to expand.

BAGNC

Kidspiration Maps for iPad came out about a  month ago. This is an adaptation of the Kidspiration and Inspiration 9 software available on PC/Mac and the iPad Inspiration app (for tweens to adults). Inspiration is a (concept but also mind) mapping program widely used in schools, and as my friend Hans Buskes (@hansbusked) has demonstrated, management consulting. So for the K-3 set and $350,000+ set, a new tool is available to combat Powerpoint and crayon fatigue.

I am not sure how I feel about using concept mapping at such a young age. I am inclined to want to see the huge research studies of efficacy school systems and educational psychologists are likely to prepare first. On the other hand, I would rather have my own children using this app than most of the so-called “educational” apps or just zapping Zombies.

I think I can say without reservation that the first time an audience sees a Kidspiration concept map presented with high level scientific results at a professional association convention, everybody will wake up laughing in the middle of their Powerpoint fueled naps.

The developers of Kidspiration Maps believe this is a Pre-K to Grade 5 product. I think it is probably best used in Grades K-3.

Some snaps from Kidspiration mapping from when I was playing around. All mapping was done by a retired 62 year old on an iPad 4. A 6 year old is more artistic and accomplished at using an iPad and probably would get better results.

Click on images to zoom.

kids2

kids7

kids6

kids5

Kids with iPads

Groceries

kids4

kids6

kids1

kids7

Click twice on the image to expand to full size.

Often one wants to “test” (logically, intuitively, deductively, empirically, through expert observations) what results from employing different strategies in business, personal life, healthcare, and education. The following mind map shows some of the issues in testing scenarios.

Maps To Explore Options Under Various Scenarios

a HubaMap™ by g j huba phd

Structural equation models, popularized by Joreskog and Sorbom within their LISREL computer program that solved long-standing mathematical estimation issues, have been recognized by many as the most powerful (or one of few most powerful) statistical model(s) available within the social and health sciences. A combination of concept mapping and mind mapping can quite effectively be used as a direct visual (or theoretical) analog of complex mathematical structural equation models. Such maps can be a good way of communicating the results of the structural equation modeling or in developing the theoretical models that will be tested. And yes, you can test the fit (appropriateness) of the models (diagrams) in a statistically rigorous way.

Yup, you heard here first (although path-like or combined mind map/concept models have been around for at least 45 years and I published hundreds of these in the late 70s though the 1990s in peer-reviewed social science and methodology journals and others simultaneously and subsequently have done the same). I am going to blog a LOT on this in the next few months. Mind and concept maps can be directly and formally simultaneously assessed if there are appropriate data available. Of course, such data are hard to come by, but not as hard as many believe.

The best way to draw concurrent concept and mind maps models is #iMindMap (using the flow chart option along with a mind map for a hybrid model). In structural equation modeling, a mind map would represent the estimation of measurement model parameters while the concurrent concept map would represent the structural model.

Mind Maps + Concept Maps can be statistically and concurrently estimated from appropriate data by Structural Equation Models.

Really.

Needs a lot of data, though. Current Macs and PCs are finally fast enough to do the statistical calculations in a notebook computer.

This is Mind Mapping 3.0 at its very best.

Much more on this topic is coming including a lot of demonstrations that mind maps and concept maps can be easily developed as a consequence of very rigorous mathematical model. And tested for goodness-of-fit.

[aaaahhh what the hell … While I am tempted to add a lot of equations, numerical analysis, and map pictures to this post, I will not do so and not mix up the media and message. This is the pilot. The series is coming this summer.]

The following generic sample illustrates what the hybrid models look like.

Constructs are measured by indicators. Indicators are usually imperfect and can be corrected in the statistical modeling. The relationship between constructs and indicators is shown in the mind map.

The constructs themselves may be related in a causal or noncausal way. The concept map shows the relationships that are present as determined by the statistical modeling.

Click on image to increase size.

Topic (correlations among constructs)

I wrote the original version of this post a few months ago, kind of tongue-in-cheek. Little did I realize that it would be the page/post most often accessed. (What do I know, I thought more people would rather look at pictures of my dog.)

These are the reformulated (actually reformatted) laws of mind mapping. All of this work, of course, falls within the more general framework of Tony Buzan, who made the seminal contributions to modern mind mapping.

I’ve now taken this whole business seriously and formulated my six laws as a real grown-up mind map. (I also took a few pictures of my dog off the web site.)

Drum roll please.

The first figure can be clicked a couple of times for various degrees of zooming.

huba's laws of  mind mapping
The next version of the mind map is annotated. Hover or click on the symbols to show comments about various portions of the map.

Appendix: Handwritten

handdrawn

Original Post

Ok, I know, kind of arrogant.

Yes and no. I do not care if you use circus colors, this year’s fashion colors, san serif fonts with kerning, cartoons, photographs, and one word per node.

More than anyone else I have ever encountered, I really give a damn about where the information in your mind map comes from. And data validity and reliability. And peer review of the map principles. And your smarts in putting together a valid and useful summary.

Wow. There needs to be an emperor, not just new clothes.

Without further ado, my self-named laws of mind mapping. It’s don’t mean a thing if the conclusions don’t swing. And, content IS Queen.

A significant number of individuals are drawing mind maps with computer programs. Others still draw them by hand.

I think we need to start calling computerized mind mapping by the term computer-assisted mind mapping as in computer-ASSISTED-mind mapping or CAMM. Unless you let the computer randomly draw the mind map from a bank of words and pictures, the program is ASSISTING you.

People are responsible for designing effective mind maps from important, valid, reliable, valid information. A good program assists in formatting the ideas. The best of the programs give you many options about how to draw the map and then produced nice artistic results that you can use as the first approximation for drawing the map.

I find it quite interesting that in spite of Tony Buzan’s strong promotion of rules for effective mind mapping, his own company’s program (ThinkBuzan, iMindMap) allows you to draw maps that clearly violate his “rules” (really best practices). I believe that ThinkBuzan decision is an excellent one: mind mapping continues to evolve with technology and development techniques.

The emphasis should be on “computer-ASSISTED.” No matter what type of mind map you wish to draw, and with any content, you are the BOSS responsible for design, valid information, and concept. Your trustworthy assistant fills in colored lines, draws curves, can rearrange the branches for optimal white space, and can even check your spelling.

  • ARTIST + ASSISTANT
  • DEVELOPER + ASSISTANT
  • SCIENTIST + ASSISTANT
  • BOZO + ASSISTANT

The key concept here is computer-ASSISTED mind mapping.

Please click on the image to zoom.

camm

I guess it’s just me … I search Google for sites with “psychology mind maps” and I get lotsa pages returned. Of course very FEW of these pages let you know where the ideas, recommendations, and organization comes from. That makes me pretty pissed off.

I have a simple rule for evaluating psycho-pop, psycho-babble, psycho-art, and psycho-schmaltz: if the author (artist, developer) cannot prove to me that the information came from a credible source and is being communicated by a credible source, I assume it is psycho-fantasy and just walk (actually run) away.

Here’s a few things to ask about before you go ahead and change your job, spouse, running shoes, or haircut because somebody gives you some magic MBTI letters, a number on a test published in a self-magazine, or advice that must be right because it appears in a pretty mind map.

I love great psychology content conveyed in an easy to understand manner. I hope I produce some. Most do not produce anything except profits. Know what you are buying (and staking your life on) when you get information from a book, TV, the Internet, text, or a graphic.

Please click on the diagram to zoom in.

Don't Believe a Psychology (Self Help) Mind Map Unless it Tells You

Although the iMindMap documentations does not seem to mention this, it is quite simple to develop stand alone flow charts that are easily formatted in iMindMap.

conceptual diagrams

And,  if you want a 3D diagram just click the button.

3d conceptual

Making concept maps, scientific path diagrams, flow charts, and other kinds of general diagrams is VERY easy and fast.  [Note: You can combine mind maps and other types of diagrams together. Or you can do a diagram without a mind map. And very rapidly with great control over format. And 3D.]

No April Fool here.