
a HubaMap™ by g j huba phd
Click on the image twice it to expand to full size.
social, health, political imagery through the lens of G J Huba PhD © 2012-2021
a HubaMap™ by g j huba phd
Click on the image twice it to expand to full size.
Created by the Gapminder Foundation: http://www.gapminder.org
Creative Commons [public domain] subject to crediting the Gapminder Foundation.
Click on image TWICE to fully expand.

Divvy is a wonderful free data visualizer program for the Mac. The program permits a number of data reductions using highly informative transformations, cluster analysis, and plots.
Indispensable for exploring data. Free. VERY fast.
Click on images to expand.
Click here to go to the Divvy web site.


Calca is a must have app if you ever have an occasion to combine numbers and text together. The app combines a terrific, very flexible, very comprehensive, and very easy-to-learn-and-use calculator with a very good markdown editor.
Here is my review clipped as a screen shot from Calca for the Mac. Note that versions are also available for the iPad and iPhone. The screen shot is followed by a review in the form of a mind map.
Click on images to expand.


a HubaMap™ by g j huba phd
It seems appropriate to present this concept as a mind map. 🙂 Click on image to expand.
a HubaMap™ by g j huba phd
This afternoon I went to the local Panera and paid by credit card. My bank declined my charge of $4.82. I figured it was the magnetic strip on the card which had failed or that the new trainee using the cash register may have made a mistake. She ran the card three more times and it was rejected. Then I got four text messages from the bank saying that they are rejected my charges. To text me, they used my phone number.
I called. They had put a hold on my card because they had some questions about my charges from the prior few days. The red flag event was that I had made an earlier charge of $9.65 at Panera about eight hours before. Their computer program was not smart enough to figure out that it was not unreasonable for someone to have breakfast at 6:30am at a Panera in Durham and then walk into a Panera in Chapel Hill later in the day with 30 minutes to kill and had a coffee (and a Danish I probably should not have had) while I played with my iPad on their free wireless connection. The computer also questioned the $1 charge at a gas station this afternoon (which the human representative immediately recognized as the established practice of gas stations opening charge lines with their automated payment systems of $1 when you swipe your card and then next day putting a $92 charge on the card for filling the tank). I was also asked if the payment made on the account was one I had made (I asked the customer service rep if she thought that if someone had paid a bill for me that I would tell her it was an erroneous transaction and she laughed for a long time) as well as a $71 charge to a software company outside the US.
They had freaked out because they could not reach me by phone at three numbers that were old ones not active (I know they have my current number because they sent me texts at it and same bank sometimes calls about my other accounts at the cell phone I never turn off and which has a voice mailbox). Of course, if they did not have a no reply text address, I could have responded to the four texts they sent.
Predictive models have been around for a decade or more in banks as they attempt to identify fraud and protect themselves. The episodes I have with my bank about every 2-3 months illustrate what happens when somebody blindly runs predictive analytic programs through big datasets without using some commonsense to guide the modeling process. Just because anyone can buy a $100,000 program from IBM or others for developing predictive analytics does not mean that the model that comes out of the Big Data and expensive program makes any sense at all.
Or that the NSA or FBI or CIA or Google or Amazon models make much sense as they probe your private information.
If a computer predictive system is going to think that somebody is committing credit card fraud because they purchase two cups of coffee at the same national restaurant chain in a day, we are in big trouble.
The bottom line is that Big Data models are going to have to be regulated before some idiot accidentally turns on Sky Net.
Or maybe the problem is that the NSA or FBI or CIA or Google has done it already.
In the 3 times a week saga, the DSL service from AT&T is down again. No cable where I live and satellite Internet access too slow. Caught between the devil and the VOID.
FATT is not fat misspelled …….

Editorial in the New York Times, July 9 2013
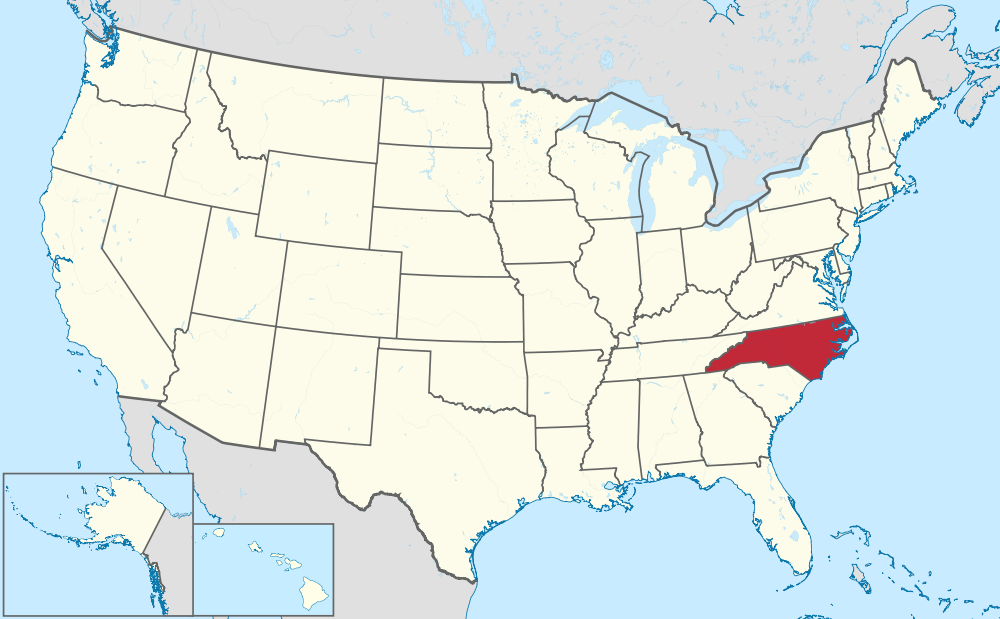
The past six months have erased the prior 30 years of growth of human rights and social net protection in North Carolina. An enviable record in advancing diversity, opportunity, and respect over decades has been reversed by a conservative legislature (both houses) and a conservative governor who urges them on. Now, the privileges of the highest income are being increased as the needs and rights of everyone else are being increasingly ignored. Shame on my home state.
Update August 8, 2013: The lunacy of the state legislature and governor continues. They seem to be destroying everything provided to those in the great need groups. North Carolina is the largest pork producing state in the US. Perhaps they should put a big pig on the official flags flown at the governor’s mansion and state capitol. (Or the current incumbents could start to fly the flag of the morally-bankrupt confederacy of 150 years ago.)
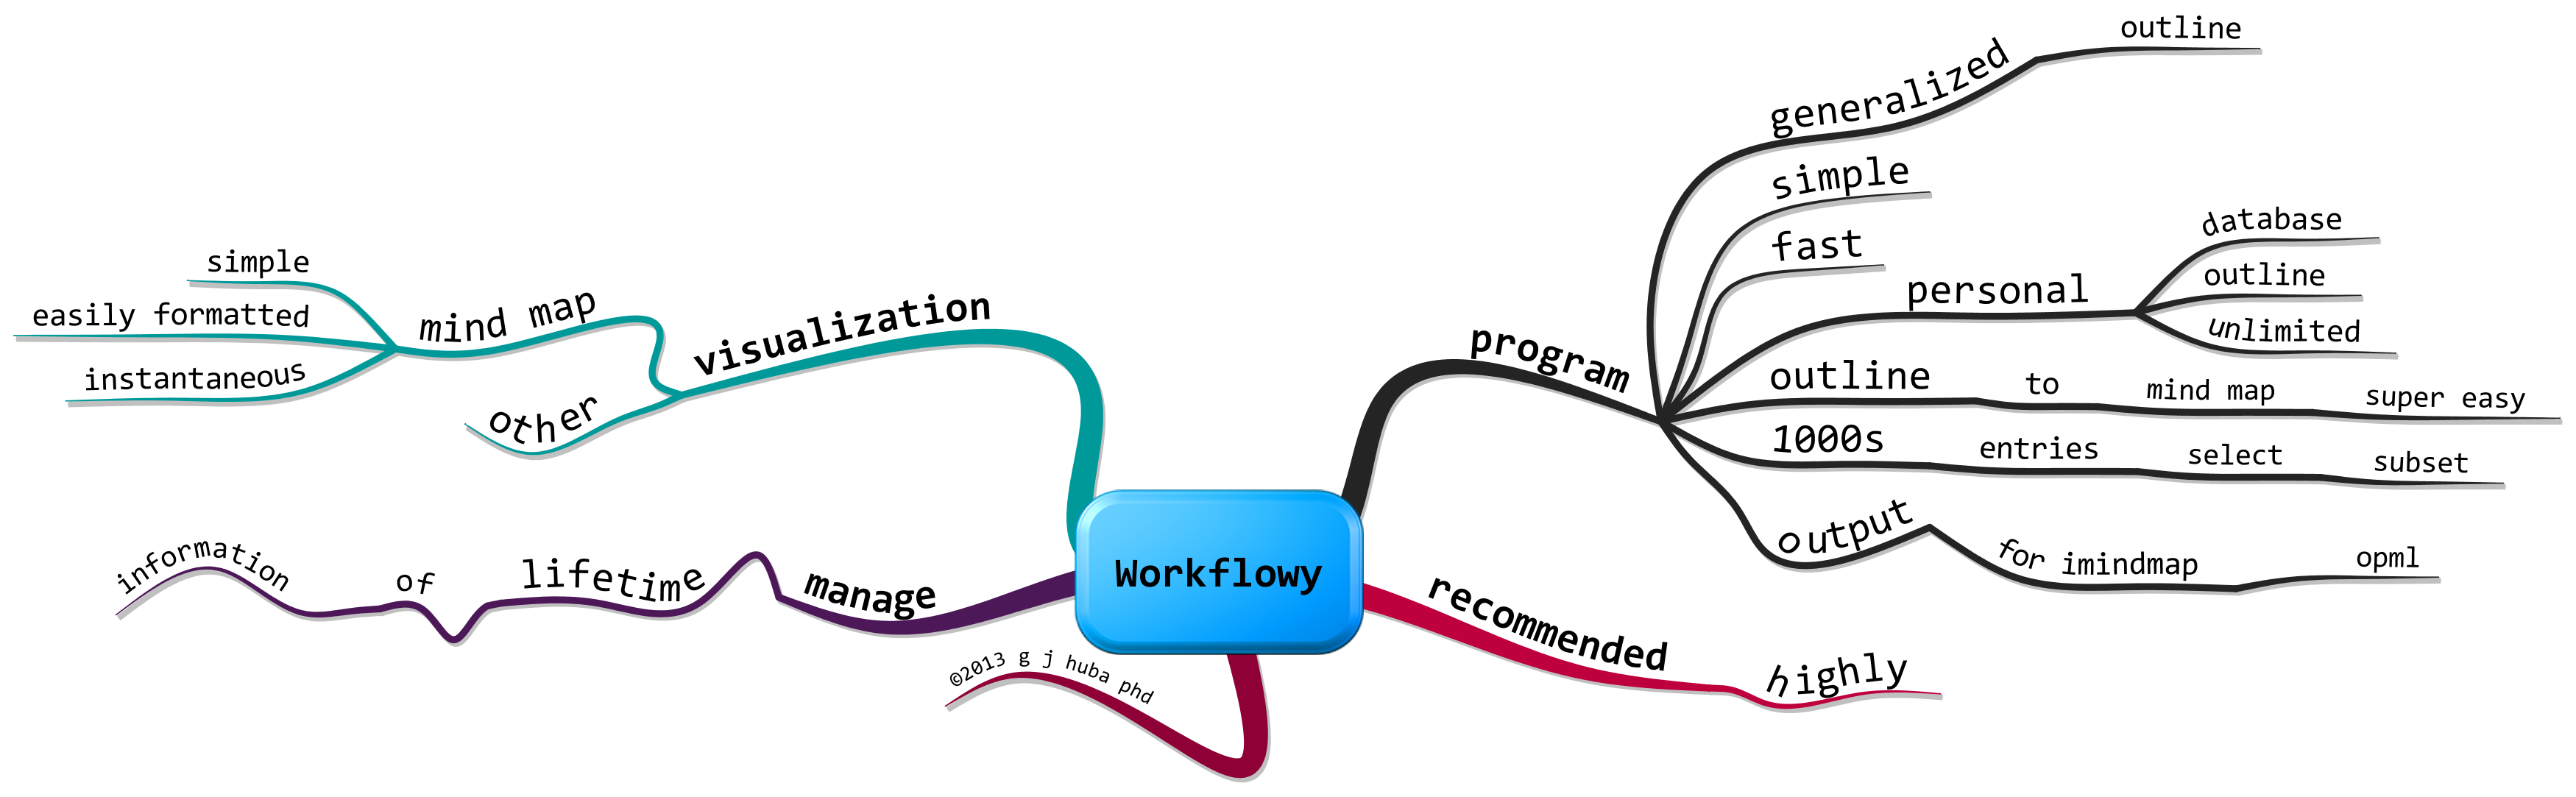
A few posts ago, I mentioned a new web, PC, Mac, iPhone, iPad app called Workflowy that lets you develop a semi-free-form outline of anything. I have been creating an outline of my life and today I added about 1000 lines (where I had lived, where I had worked, the family tree and their health issues, my favorite movies by type, where my parents had taken me on summer vacations, where I had taken my family on vacations, where I visited on business, and a few other things). Since this is a free-structure outline database, I can easily reorganize items later (drag-and-drop).
I am getting all of these “facts” down both for myself to understand how the many things I did in 62 years fit together into a coherent whole view of my life. I also want to leave a “Manual of the Life of George Huba” behind for my children and grandchildren about what health problems their father and his side of the family had so that they can screen for such issues later in their lives, the family tree of folks we never talked about, events in my life they know about such as family vacations, and events they know very little about like starting a business or prior life events. A whole life in outline form (with notes).
What sold me on using Workflowy (I have tried alternative programs in the past; this one works much better) for the data collection/assembly is the fact that portions of the outline are easily captured, output as OPML files, and then can be imported into iMindMap, creating very useful mind maps almost magically. A couple of minutes of adding a few creative touches (I am too obsessive-compulsive to resist the temptation to customize) and there are useful visual displays of portions of my life.
Do yourself a favor, and capture such information as your life unfolds. Look at how the different themes go together and know yourself better. Look at the data visually in a mind map and other visualizations. And leave hard copy and data files behind for your family. This will be a huge gift.

a HubaMap™ by g j huba phd
Coke does it. BMW does it. Lexus doe it on the Food Network cooking shows. Thousands of others do it. Product placements are now one of the highly profitable parts of modern movie and television film making.
Wouldn’t it be nice if the film studios “donated” some product placements in their movies and television shows to healthy behaviors like selecting a healthy diet or exercising after a hectic day of crime fighting to relax or drinking water. Heck, I would even give them a tax deduction for the minutes in the film “promoting” healthy behaviors.
Heck, even the villans could be healthy, or alternately die off because they eat too many hamburgers.

a HubaMap™ by g j huba phd
I have wasted much of my professional life (writing time) since 1985 messing around with fonts and formatting indents and outlines and bullets and placement and TABLES and bibliographies while trying to actually create original content. It was always a lot easier to fool around with the next great font or the indent levels on bullets than it was to focus on the content. WordPerfect (I am that old) and Microsoft Word and more recently Apple Pages were not the great steps forward in productivity they claimed to be. [Before 1985 who ever cared what font text was in or how the bullets lined up? In fact, who ever knew what a bullet was before 1985?] I have come to think in recent years that “office automations” may be one of the lowest circles of hell for content creators.
Like many, I have gotten interested in writing environments and other tools that just let you write and don’t tempt you with a font change or better spacing while you are trying to actually finish writing a creative page. If I could only have all of that time spent changing fonts and styles I wasted over 27 years back, I probably could have written two more books.
So far as I can see, I am not the only one who is seeking to get rid of the distractions from Word and Pages and their ilk; there is a booming market on the Mac for writing environments, enhanced text editors, and simple word processors. I downloaded a copy of Ulysses III today after thinking about it for months and agonizing over the choice between Ulysses and Scrivener. [I did something I rarely do and actually made quite a bit of use of the demo versions of each program.] Within the next few days I expect that I will be brave enough to remove Pages and maybe even Word from my Mac. [Yes, of course I am keeping the backups, I am not that brave!] My initial experience is quite encouraging; as many have found writing in Markup (the enhanced text language of most of the current crop of writing environments) the change is for the better.
At the same time that I have concluded that formatting is not an integral part of the creative process of writing original text, I concluded that formatting IS an integral part of the creative process in mind mapping where it can help develop innovative models and methods of visual expression. I have determined this by using both the most elaborate and creative mind map program (iMindMap) that gives you great creative control over visual thinking and other programs that prepare visuals that look like my pencil drawings on file cards. Color and organic looks and clip art and spatial reorganization are integral parts of the visual creative process and become part of the creation.
A Duh Moment: Stop wasting a lot of time on formatting text materials while you are creating them. Invest your “formatting time” into creating compelling visual models using mind maps or alternatives.
It is all so obvious after you try it.
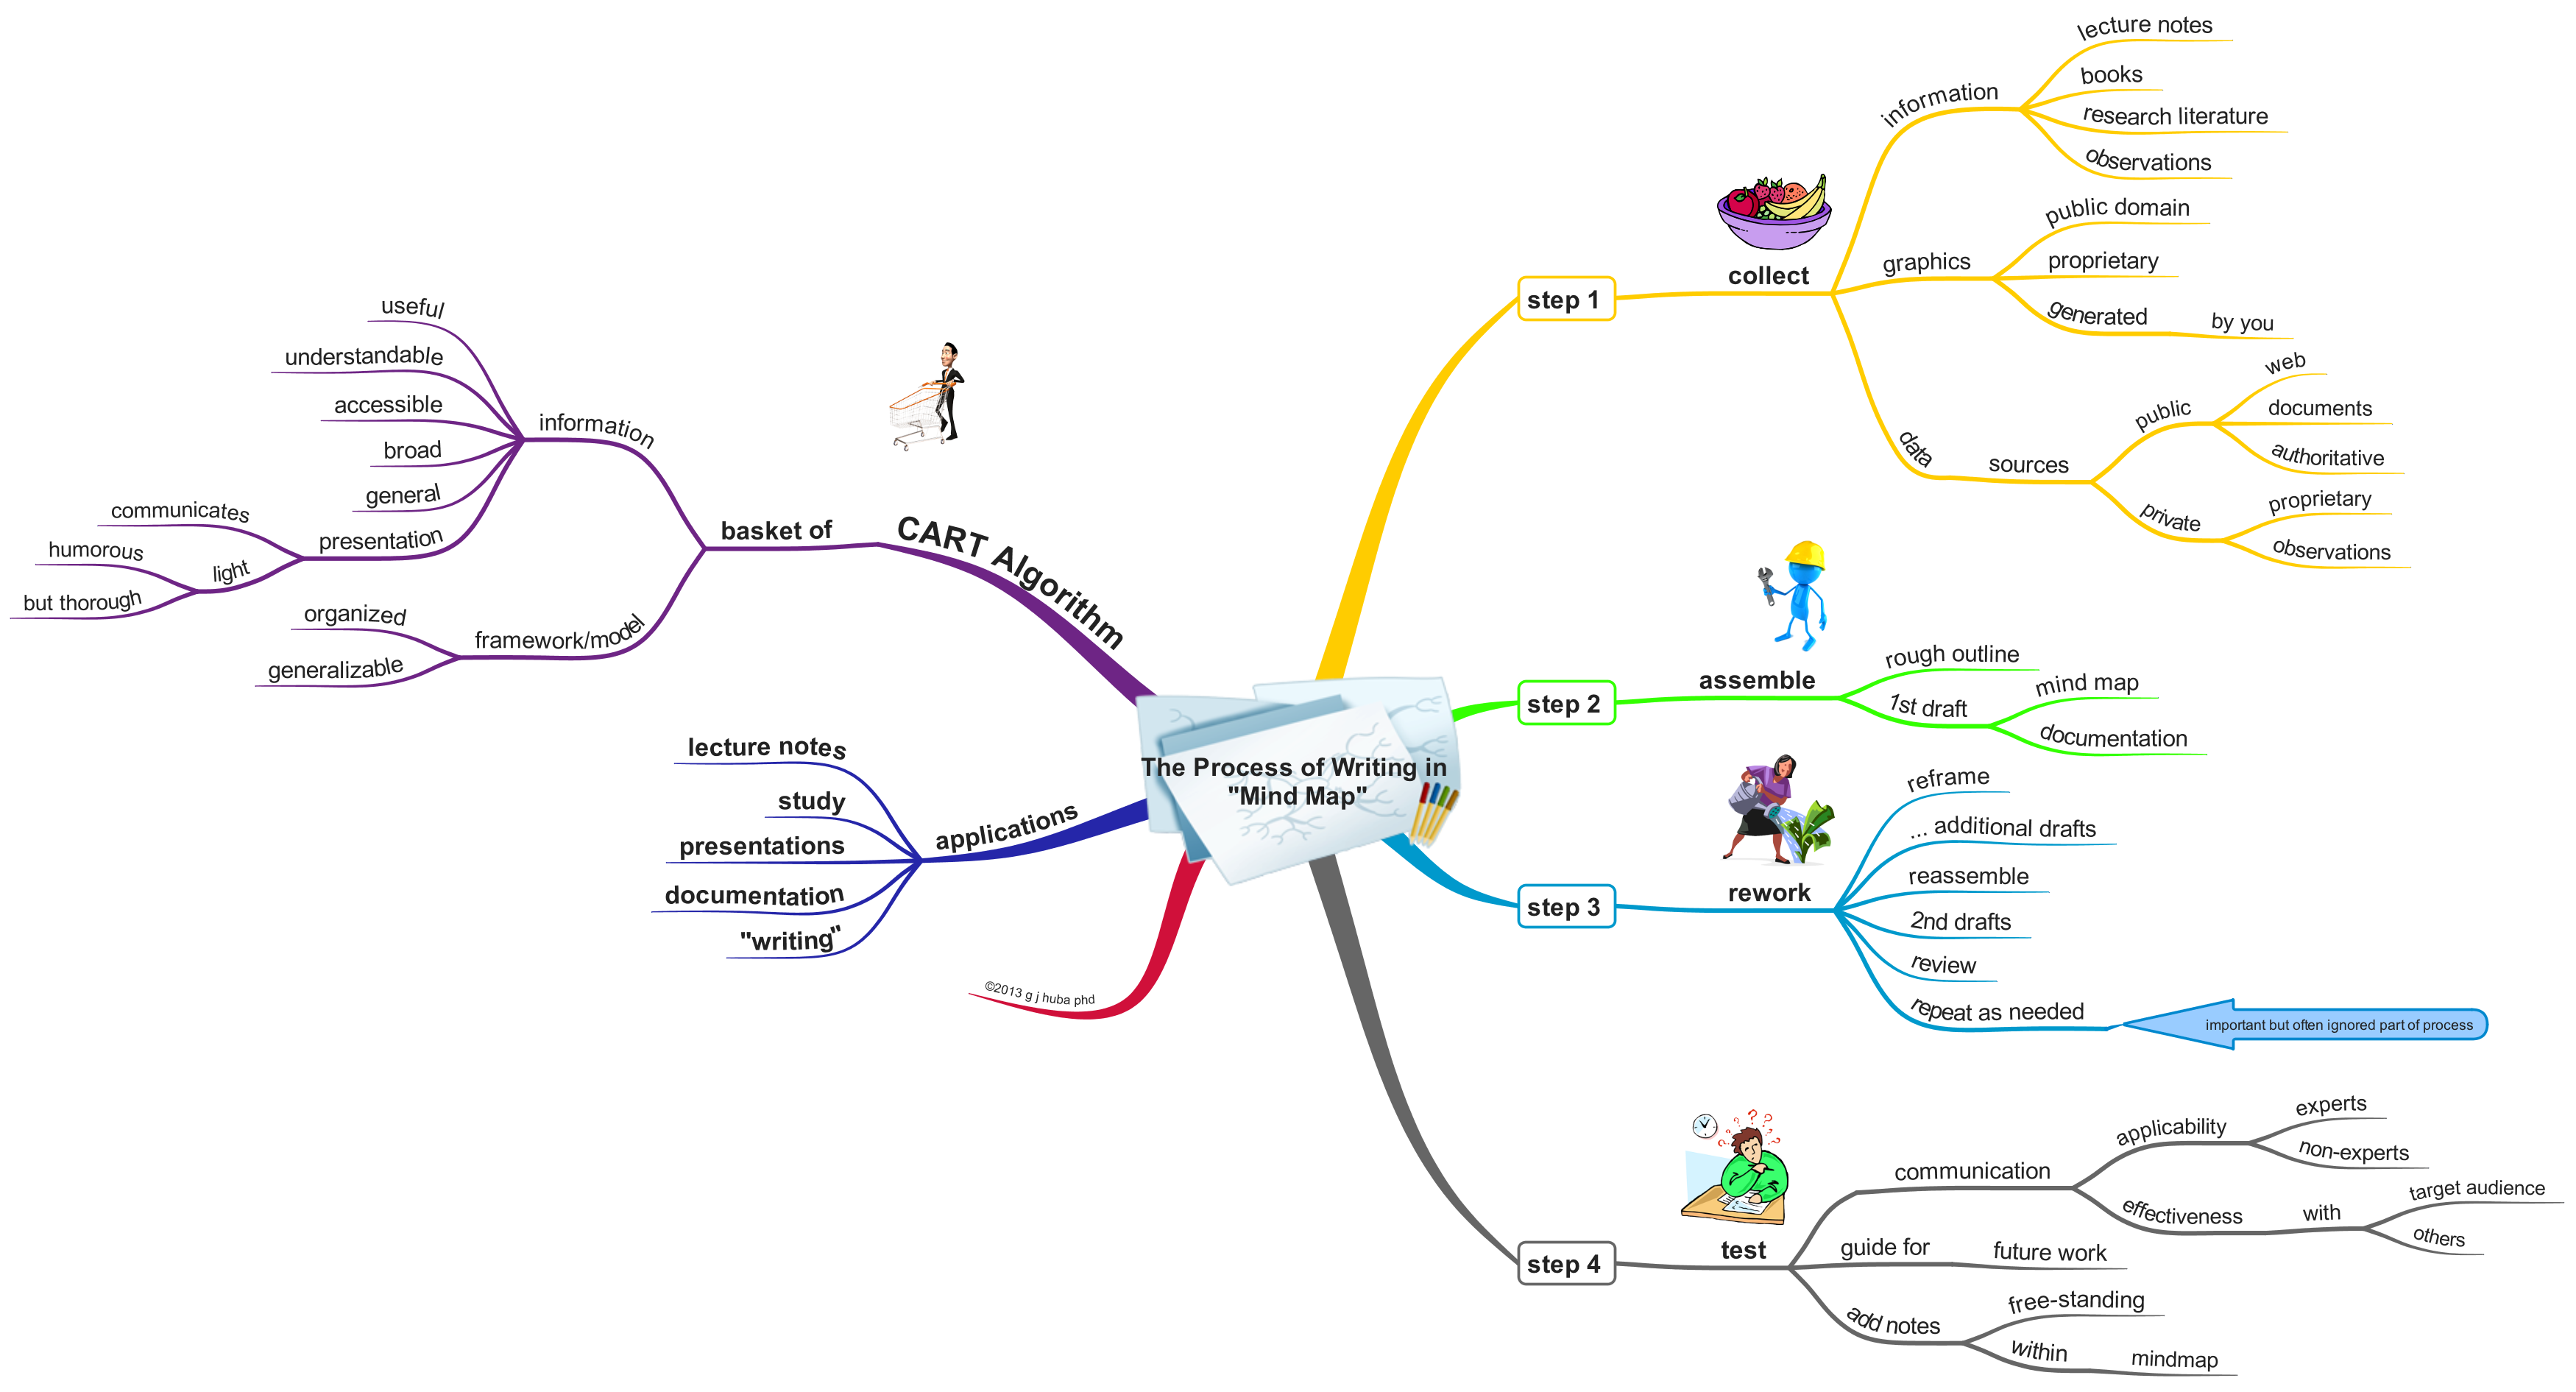
When I start to work with technical research information, I find that size of the maps quickly grows.
There are limits to the brain’s processing of complex information and the computer’s ability to display image details at a size you can see.
Here are a few different models for presenting the same mind map. Which model do you think is best?
Click images [once or twice] to expand.
Model 1: “I hope you have a big display and sharp eyes”

Model 2: “Big Bang — Universe of Information”


Model 3: “Stand in Line for One at a Time”


[ADD REMAINING SINGLE BRANCH VARIANTS … AND THEN TOTAL SHOWN BELOW]
My conclusion is that Models 2 and 3 are best for large maps, but that the selection between of these models needs to be made considering the overall size of the full map, the audience, and the topic. Model 3 is the more traditional, but Model 2 may be the best for either web or live presentation applications.
I prefer Model 1 for small maps presented online.
As I age (and have time during my retirement), I have been reading a lot about the neurodegenerative diseases (Alzheimer’s, Parkinson’s Lewy Body Dementia, FTLD) and upcoming crises in the healthcare system as people live longer and are more likely to experience one of these conditions. At the same time, I have reading about the absolutely brilliant work being done in neuroscience and medicine (neurology) on the functions of the brain. I am totally in awe at the quality of the science going into brain research.
As a consequence, I am starting this page of citations to publish bibliographies of basic science articles that provide possible mechanisms for studying the efficacy of mind mapping and other visual information techniques in neurodegenerative conditions (Alzheimer’s, Parkinson’s, Lewy Body Dementia, Frontotemporal Dementia or FTD or FTLD, CBD, PSP, and other conditions).
Searches of medical databases tend to produce a highly technical bibliography. NONE of the articles proves a neurogenesis mechanism is stimulated by mind mapping or even that one exists. NONE of these articles proves that mind mapping is effective. What the articles do is to present a selected bibliography of research into brain plasticity and neurodegenerative conditions. Science is all about reviewing prior work (original research, summaries, meta-analyses, theory) and seeing where we go next. Translational research is about taking the results of basic research and developing better treatments, diagnosis methods, and care management.
My own belief is that after degeneration the brain is probably still somewhat plastic and can recode information into alternate forms. Visual learning methods may be helpful to stimulate or guide recoding and shifting functions to less affected areas of the brain. Visual learning methods CANNOT treat a brain disorder, but they may be valuable assistive aids to slow the degeneration of the individual’s quality of life and independence even though they will never be a treatment to slow actual brain deterioration. I believe that it is possible to stimulate relatively less affected areas of the brain to take over some of the functions of those areas that are shrinking. Visual learning and data re-organization (with mind maps being a primary method) probably help to slow the slide of individual patients into stages where they are highly dependent on a caregiver and cannot participate in many formerly enjoyable interactions and activities. NONE of the studies in the articles in my literature searches proves that I am right.
We have learned a huge amount in the past THREE years about how the brain works. This is just the beginning. Until such time as there are truly effective medical treatments (developed from research) that can prevent or “fix” neurodegeneration, well-established, visual cognitive tools may provide help in slowing the fall in the individual’s quality of life. And in future decades we will have a much better understanding of the synergistic roles of formal medical treatment for neurodegeneration and visual methods of learning, memory retrieval, and decision making.
This is going to be a cumulative set of database searches. I will periodically add searches of public access (free) medical databases. At those times I will republish the page with the date of revision and version number.
The results of the searches are not medical treatment advice. The results are not suggestions for future research. The results are not exhaustive. No guarantee of the quality of individual research articles is made or implied by inclusion in these searches.
Search PubMed for information on human research on brain plasticity neurodegenerative

Help support the continuing evolution of our understanding of the brain, medical treatments, and useful visual learning and cognitive methods for slowing the deterioration of quality of life by learning about the scientific research going on. (And yes, I support stem cell research.)

Delays (no surprise here) in implementing Obamacare have led to the “new” Republican mantra that the law is unworkable.
Grow-up. The Congress passed Obamacare by a majority. The President signed the bill into law. The Supreme Court (led by a Republican-appointed Chief Justice) said the law was constitutional.
Is there any part of this the Congressional Republicans do not understand?
It is very hard to build a system (factory assembly line) so that all of the parts work together, are reliable, produce the intended result, have quality, and are appropriately timed.
Any idiot can throw wooden shoes in the machinery.

Help build the assembly line as did our ancestors of more than 200 years ago. We all benefit from cooperation and well-conceived majority rule.
been doing it for more than year. gets laughs and people remember. kids seem to love getting these.
click to zoom.

I regularly say “Content is Queen” in respect to developing useful, content-based mind maps that communicate well to others.
I challenge any class of MPH (Masters of Public Health) students to individually take a standard set of health-medical information and express them as a mind map using an organization and style designed to make the content of the map memorable, easy to remember, and conducive to behavior change or attitude adjustment.
Here are a few areas I am considering for mind maps. The information I would use is from standardized fact sheets prepared and presented by a highly credible health-medical organization.
For example, the Alzheimer’s Association (http://www.Alz.org) has 10 facts about Alzheimer’s Disease, 7 stages of Alzheimer’s, and types of dementia on its web site. Why not have the 20 students in a graduate class each independently develop a map and then rate each other’s work on effectiveness of message, accuracy of content, accessibility to all likely readers.
The (USA) National Institute on Aging (http://www.nia.nih.gov) has many fact sheets on its site about different aspects of aging. The facts sheets might be able to be improved with mind map or other visual representations.
There are an awful lot of good mind maps to be drawn from health data and recommendations that might be awfully helpful to health education-prevention efforts. Let’s figure out how to make these maps communicate as well as possible.


I recently discovered an extremely flexible and easy to use a free-form outliner : Webflowy. On the web the program runs on Mac and PC; there are also iPad and iPhone apps, and everything synchs pretty effortlessly.
I have hundreds of list like events that occur daily:
Workflowy is really simple to use and you will want it open on your notebook computer continuously.
A section of my life outline (everything combined) is shown below. Note that the outline expands and contracts easily, allows hashtags, has a good search algorithm, and easily produces OPML (and other) output. This section of the outline captures what I was thinking today as I experimented with Workflowy.

Want a picture? Select, save as OPML and open (import) in iMindMap. You can play around a little with the format or just use one of the built-in options. You can “alter” the outline-map and re-export easily to the Workflowy document.
Now my life will be better “saved” and visualized easily.
No more excuses. [Well, I coulda/shoulda added images to the mind map, but I was just trying to make a basic point about Workflowy. You will have a very useful mind map by just letting the mind map program run at its default settings when importing Workflowy data. You got it so I don’t feel guilty about not adding some graphic elements.]
As usual, click images to zoom.
Still feeling a little guilty — July 6, 2013 — here is a mind map that is better with added graphics from iMindMap.


