Info

social, health, political imagery through the lens of G J Huba PhD © 2012-2021

Posts tagged Psychology

Coke does it. BMW does it. Lexus doe it on the Food Network cooking shows. Thousands of others do it. Product placements are now one of the highly profitable parts of modern movie and television film making.

Wouldn’t it be nice if the film studios “donated” some product placements in their movies and television shows to healthy behaviors like selecting a healthy diet or exercising after a hectic day of crime fighting to relax or drinking water. Heck, I would even give them a tax deduction for the minutes in the film “promoting” healthy behaviors.

Heck, even the villans could be healthy, or alternately die off because they eat too many hamburgers.

health promotion product placements


a HubaMap™ by g j huba phd


As I age (and have time during my retirement), I have been reading a lot about the neurodegenerative diseases (Alzheimer’s, Parkinson’s Lewy Body Dementia, FTLD) and upcoming crises in the healthcare system as people live longer and are more likely to experience one of these conditions. At the same time, I have reading about the absolutely brilliant work being done in neuroscience and medicine (neurology) on the functions of the brain. I am totally in awe at the quality of the science going into brain research.

As a consequence, I am starting this page of citations to publish bibliographies of basic science articles that provide possible mechanisms for studying the efficacy of mind mapping and other visual information techniques in neurodegenerative conditions (Alzheimer’s, Parkinson’s, Lewy Body Dementia, Frontotemporal Dementia or FTD or FTLD, CBD, PSP, and other conditions).

Searches of medical databases tend to produce a highly technical bibliography. NONE of the articles proves a neurogenesis mechanism is stimulated by mind mapping or even that one exists. NONE of these articles proves that mind mapping is effective. What the articles do is to present a selected bibliography of research into brain plasticity and neurodegenerative conditions. Science is all about reviewing prior work (original research, summaries, meta-analyses, theory) and seeing where we go next. Translational research is about taking the results of basic research and developing better treatments, diagnosis methods, and care management.

My own belief is that after degeneration the brain is probably still somewhat plastic and can recode information into alternate forms. Visual learning methods may be helpful to stimulate or guide recoding and shifting functions to less affected areas of the brain. Visual learning methods CANNOT treat a brain disorder, but they may be valuable assistive aids to slow the degeneration of the individual’s quality of life and independence even though they will never be a treatment to slow actual brain deterioration. I believe that it is possible to stimulate relatively less affected areas of the brain to take over some of the functions of those areas that are shrinking. Visual learning and data re-organization (with mind maps being a primary method) probably help to slow the slide of individual patients into stages where they are highly dependent on a caregiver and cannot participate in many formerly enjoyable interactions and activities. NONE of the studies in the articles in my literature searches proves that I am right.

We have learned a huge amount in the past THREE years about how the brain works. This is just the beginning. Until such time as there are truly effective medical treatments (developed from research) that can prevent or “fix” neurodegeneration, well-established, visual cognitive tools may provide help in slowing the fall in the individual’s quality of life. And in future decades we will have a much better understanding of the synergistic roles of formal medical treatment for neurodegeneration and visual methods of learning, memory retrieval, and decision making.

This is going to be a cumulative set of database searches. I will periodically add searches of public access (free) medical databases. At those times I will republish the page with the date of revision and version number.

The results of the searches are not medical treatment advice. The results are not suggestions for future research. The results are not exhaustive. No guarantee of the quality of individual research articles is made or implied by inclusion in these searches.

Search PubMed for information on human research on brain plasticity neurodegenerative

Literature  Search 1

Help support the continuing evolution of our understanding of the brain, medical treatments, and useful visual learning and cognitive methods for slowing the deterioration of quality of life by learning about the scientific research going on. (And yes, I support stem cell research.)

This mind map shows SOME of the ways SOME people may feel during cognitive decline. The mind map is not for self-diagnosis nor is it medical or psychological advice. If you believe that these conditions affect you or an individual under your care, seek diagnosis and advice from your primary care physician, a neurologist, psychiatrist, or other physician.

Click twice on image to zoom in.

Some Feelings During Cognitive Decline to Dementia

Click on images to expand.

Source materials for the following mind map

Alzheimer’s Association http://www.Alz.org

USA National Institutes on Health http://www.NIH.gov

Common Types of Dementia Sep 2013

Some Suggestions by G J Huba PhD About How Mind Mapping Might Help Address Some Cognitive Symptoms of Dementia

what neurologically-impaired individuals might gain from mind mapping

Structural equation models, popularized by Joreskog and Sorbom within their LISREL computer program that solved long-standing mathematical estimation issues, have been recognized by many as the most powerful (or one of few most powerful) statistical model(s) available within the social and health sciences. A combination of concept mapping and mind mapping can quite effectively be used as a direct visual (or theoretical) analog of complex mathematical structural equation models. Such maps can be a good way of communicating the results of the structural equation modeling or in developing the theoretical models that will be tested. And yes, you can test the fit (appropriateness) of the models (diagrams) in a statistically rigorous way.

Yup, you heard here first (although path-like or combined mind map/concept models have been around for at least 45 years and I published hundreds of these in the late 70s though the 1990s in peer-reviewed social science and methodology journals and others simultaneously and subsequently have done the same). I am going to blog a LOT on this in the next few months. Mind and concept maps can be directly and formally simultaneously assessed if there are appropriate data available. Of course, such data are hard to come by, but not as hard as many believe.

The best way to draw concurrent concept and mind maps models is #iMindMap (using the flow chart option along with a mind map for a hybrid model). In structural equation modeling, a mind map would represent the estimation of measurement model parameters while the concurrent concept map would represent the structural model.

Mind Maps + Concept Maps can be statistically and concurrently estimated from appropriate data by Structural Equation Models.

Really.

Needs a lot of data, though. Current Macs and PCs are finally fast enough to do the statistical calculations in a notebook computer.

This is Mind Mapping 3.0 at its very best.

Much more on this topic is coming including a lot of demonstrations that mind maps and concept maps can be easily developed as a consequence of very rigorous mathematical model. And tested for goodness-of-fit.

[aaaahhh what the hell … While I am tempted to add a lot of equations, numerical analysis, and map pictures to this post, I will not do so and not mix up the media and message. This is the pilot. The series is coming this summer.]

The following generic sample illustrates what the hybrid models look like.

Constructs are measured by indicators. Indicators are usually imperfect and can be corrected in the statistical modeling. The relationship between constructs and indicators is shown in the mind map.

The constructs themselves may be related in a causal or noncausal way. The concept map shows the relationships that are present as determined by the statistical modeling.

Click on image to increase size.

Topic (correlations among constructs)

Let’s be honest, there is not enough empirical, hard scientific evidence that mind map based learning programs are as effective as there should be. In fact there is FAR less evidence to support efficacy claims about mind mapping than there should be. This has to be fixed.

Before the mind mappers start cursing me out, put this into context — I strongly support mind mapping and think it should be used far more than it is But I cannot find specific studies that strongly support efficacy.

Don’t flip the channel yet … I am now going to give you the most valuable free consulting I have ever provided anyone.

A few studies give people some training into “who knows what” mind mapping and see if they remember or “learn who knows what” better. Creativity is not measured, communication is not measured, long-term efficacy is not measured, training clinical practice efficacy is not measured, and many other aspects of cognitive enhancement claimed are not measured. Still, I believe that mind mapping is useful for most of these things and mind mapping works.

Now “prove” it.

Here is the biggest reason why mind mapping has not been shown to work in anything approaching a “definitive” scientific study or unbiased evaluation — too many things are called “mind mapping” are all lumped together.

A strong research (evaluation) design includes the following factors.

a) Different things called mind mapping are compared. As I see it, there is are three major things called “mind mapping.” The first is Buzan-style organic mind mapping. My bias is to say that this will work best in most (but not all) applications, but I would like to see hard data that my observations are correct. The second style of mind mapping is that embraced by those who use Mindjet aka Mind Manager and comparable programs. Such a style seems to be preferred among business types, and I used Mindjet (formerly known as Mind Manager) for about 15-20 years with many different types of health- and social-care professionals. Then there are dozens of other methods and diagrams called “mind maps,” most of which probably could be called spider maps. I would clump all of these methods together although I do recognize that the category is very heterogeneous.

Addition to original post: Separating these three categories will almost certainly show that the three clusters of methods are not equally effective for all applications. Combining them together dilutes the effects of the first and second methods because the third is probably comprised of a number of less than effective methods.

b) The effects of mind mapping need to be maximized. That is, the participants learning mind mapping or being taught to read existing mind maps need to be trained by experts (and I mean real top-of-the-food-chain mind mapping instructors) in one of the three types of “mind mapping.” The instructor needs to be a “real pro” at this, not a teacher or consultant who has had minimal formal training in mind mapping. Random assignment of participants (subjects) to one of the three mind mapping conditions needs to be made.

c) A lot of before and after variables need to be measured like memory, creativity, ability to learn new materials, ability to increase upon prior knowledge, sophistication of information processing, and all of the other things people claim about mind mapping.

d) Then the data need to be analyzed for enhancements (or not) from mind mapping according in each of the three three dominant models. That is, there needs to be a study of the interactions of learning one of the three mind mapping models from an expert, type of application, and type of effects.

Show me a dozen studies that support mind mapping (with random assignment, large samples, and conducted by a neutral investigator in this highly competitive commercial area) and I will tell everyone it has been proven that mind mapping works for these 10 applications and not these 5 others and what the best kind of mind mind mapping is for achieving certain goals.

Show me even better and more complex studies and I will jump with glee that my own observations have been confirmed.

Or, if it doesn’t work, accept the fact that this is voodoo, a management-education-training fad, or just plain commercial exploitation. (I don’t believe it is any of these things but I also cannot say YET that science unequivocally understands mind mapping.)

You wanna make the big claims, get independent parties to test them in an unbiased way that meets the most rigid scientific-educational standards. The odds are you will be happy you did as will potential users and educator-trainers.

[If you are an education, psychology, neuroscience, or healthcare student there are a lot of good PhD dissertations to be written in this area.]

A few of my examples of using mind maps from around this blog/website.

Click images to zoom.

blank canvas  apps not  mind maps

Obvious  Answer comfort work 35 crazy computer saturday3 huba's laws of  mind mapping

iPad mailbox app Software  Rankings  Visual Links handdrawn

Irv Oii hubaisms.com  est. 2012 small want

XM Evaluating Mind Maps with %22Expert Content%22 iMindMap5 MapUnited States Presidents Timeline Final

writing in mind map

No, I haven’t lost “it” and this is not a science fiction story.

With the unleashing of big data, big computing, big temptations, and big greed, it is going to be real tempting to develop a George Huba (and also perhaps a Bill Smith or Mary Doe or heaven forbid, a Donald Trump) computer model that can fairly accurately predict from my lifetime experiences whether one will buy a new car next year (and what type and in which cost range and maybe from which car dealer), purchase or sell a home, shift from converse to adidas sneakers, become emotionally distressed if no chocolate is available, and purchase Apple stock to invest or trade. Or run a simulation of one as the CEO of a particular company to determine who gets the job. Or look at one’s medical history and determine whether it is likely thatgrandchildren will have each of 20 expensive diseases that no insurer wants to touch.

Already the IRS runs programs to estimate the likelihood I cheated on my income taxes, Amazon runs programs to estimate the likelihood I will purchase certain books and socks before or after the December holidays, and my credit card company runs models to determine whether it is likely or not that I purchased shoes while on a business trip (yup, they once froze my credit card while I was in DC on business because their computer model says I only buy sneakers).

OK, so the accuracy of the big data scientists is only something like 20-50% now. What do you think it will be when your book purchasing history is fully integrated with your job history, income, ice cream purchases, pharmaceutical purchases, video watching history, total hamburger purchases, and BMI? And then fine tuned with the grade you got in college English, chemistry, or psychology; whether you had a hiking or a beach vacation and if you purchased (used) sunscreen and had a history of purchasing sun hats; the diseases that all four of your grandparents and parents had at different times in their lifetimes. And whether your car is more than 3 years old. And what do you think it will be when we create a generation of data scientists willing to capitalize on huge data to build such models for salaries that will approach those of professional athletes and rock stars? Most of the world’s richest people are already individuals who are promoting and benefitting from big data to predict what you will do.

Ten years from now, the computer models produced of selected individuals will make Mark Zuckerberg, the Google guys, Apple, and Jeff Bezos look like rank amateurs in profiling. The Russians and Chinese, of course, are already well advanced and a threat every time we vote.

[Oh, and by the way while writing this post Google knows that I looked up Mark Zuckerberg’s name and the spelling of adidas.]

I want to tell anyone that wants to develop a mathematical, computer model of me (or my behavior, beliefs, attitudes, skills, history, and future intentions) to cease and desist. Or [more indelicately] fuck off.

Which raises the questions … Do I own the copyright (patent, trademark) to my own life? [And if I do, what are the limits and will violations of those laws by a number of countries and companies be ignored?]

This is not so far-fetched. I spent my whole life becoming the person I am. Does anybody have the right to take all of the big data about me and distill my life down to formulae and algorithms that will explain my past and current behavior and predict what I will do in the future? Should people be allowed to model individuals, I fear that the suicide rate will go up dramatically as people find out how much these models can be used to control them and when they are predicting you will die.

As a psychologist, I spent my career studying people so that we might better understand their fears and concerns, help them better use their full potential, become happier, control their own aggressive or violent tendencies, and generally become the people THEY WANTED to be. And I, nor other ethical psychologist, struck out with the intent to model the behaviors of others so well that the resulting models could be sold to governments and corporations.

Big and huge data, data scientists, companies, and governments need to be prohibited from violating the rights of individuals to “own” their individual lives. If we ever let others “own” our individual identities, we will have crossed into new territory from which there is no return. The technology is almost there to create such individual mathematical models. Russia, for instance, seems to have a pretty good Trump model they are licensing to the Saudis and others.

I was endowed by my creator to own the copyright, patents, and trademarks of my own life… and to answer for what I chose to do with that intellectual property (free will). I choose not to sell my soul to the devil, it’s data scientists, psychologists, and hackers.

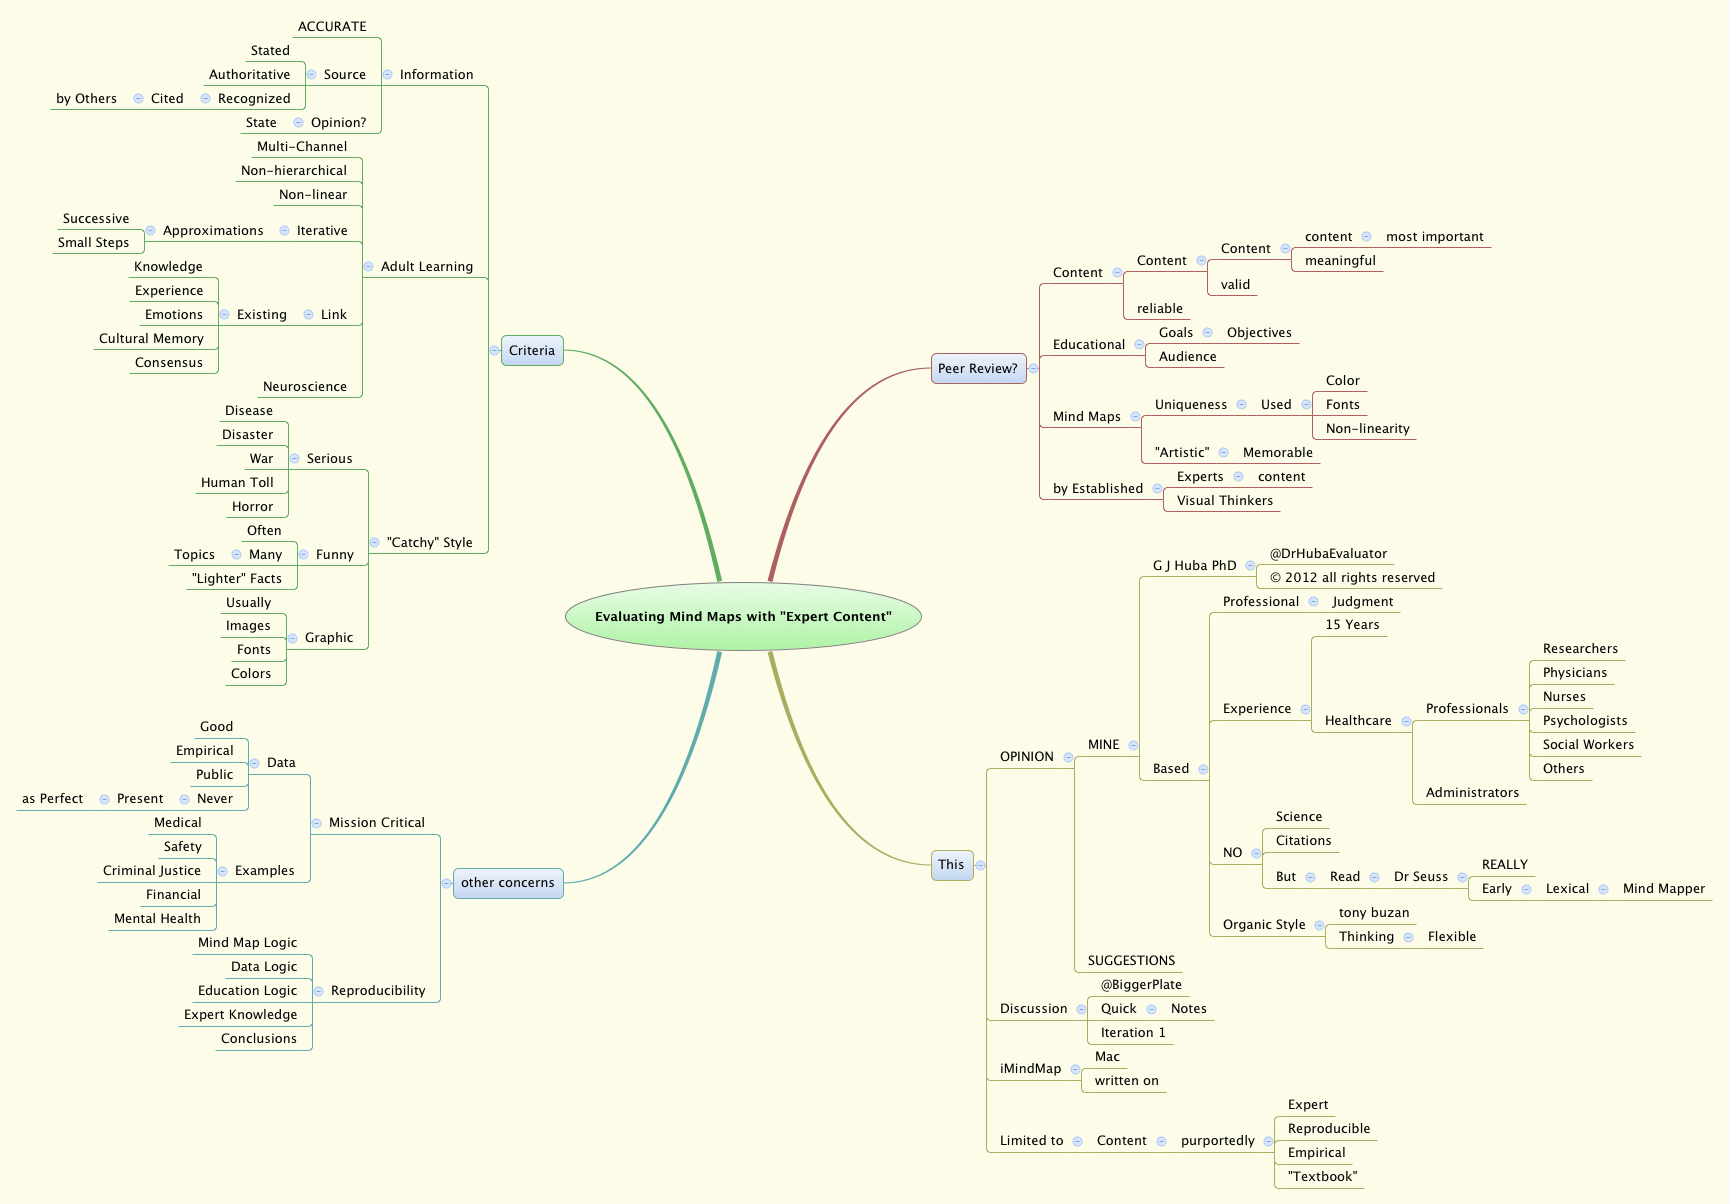
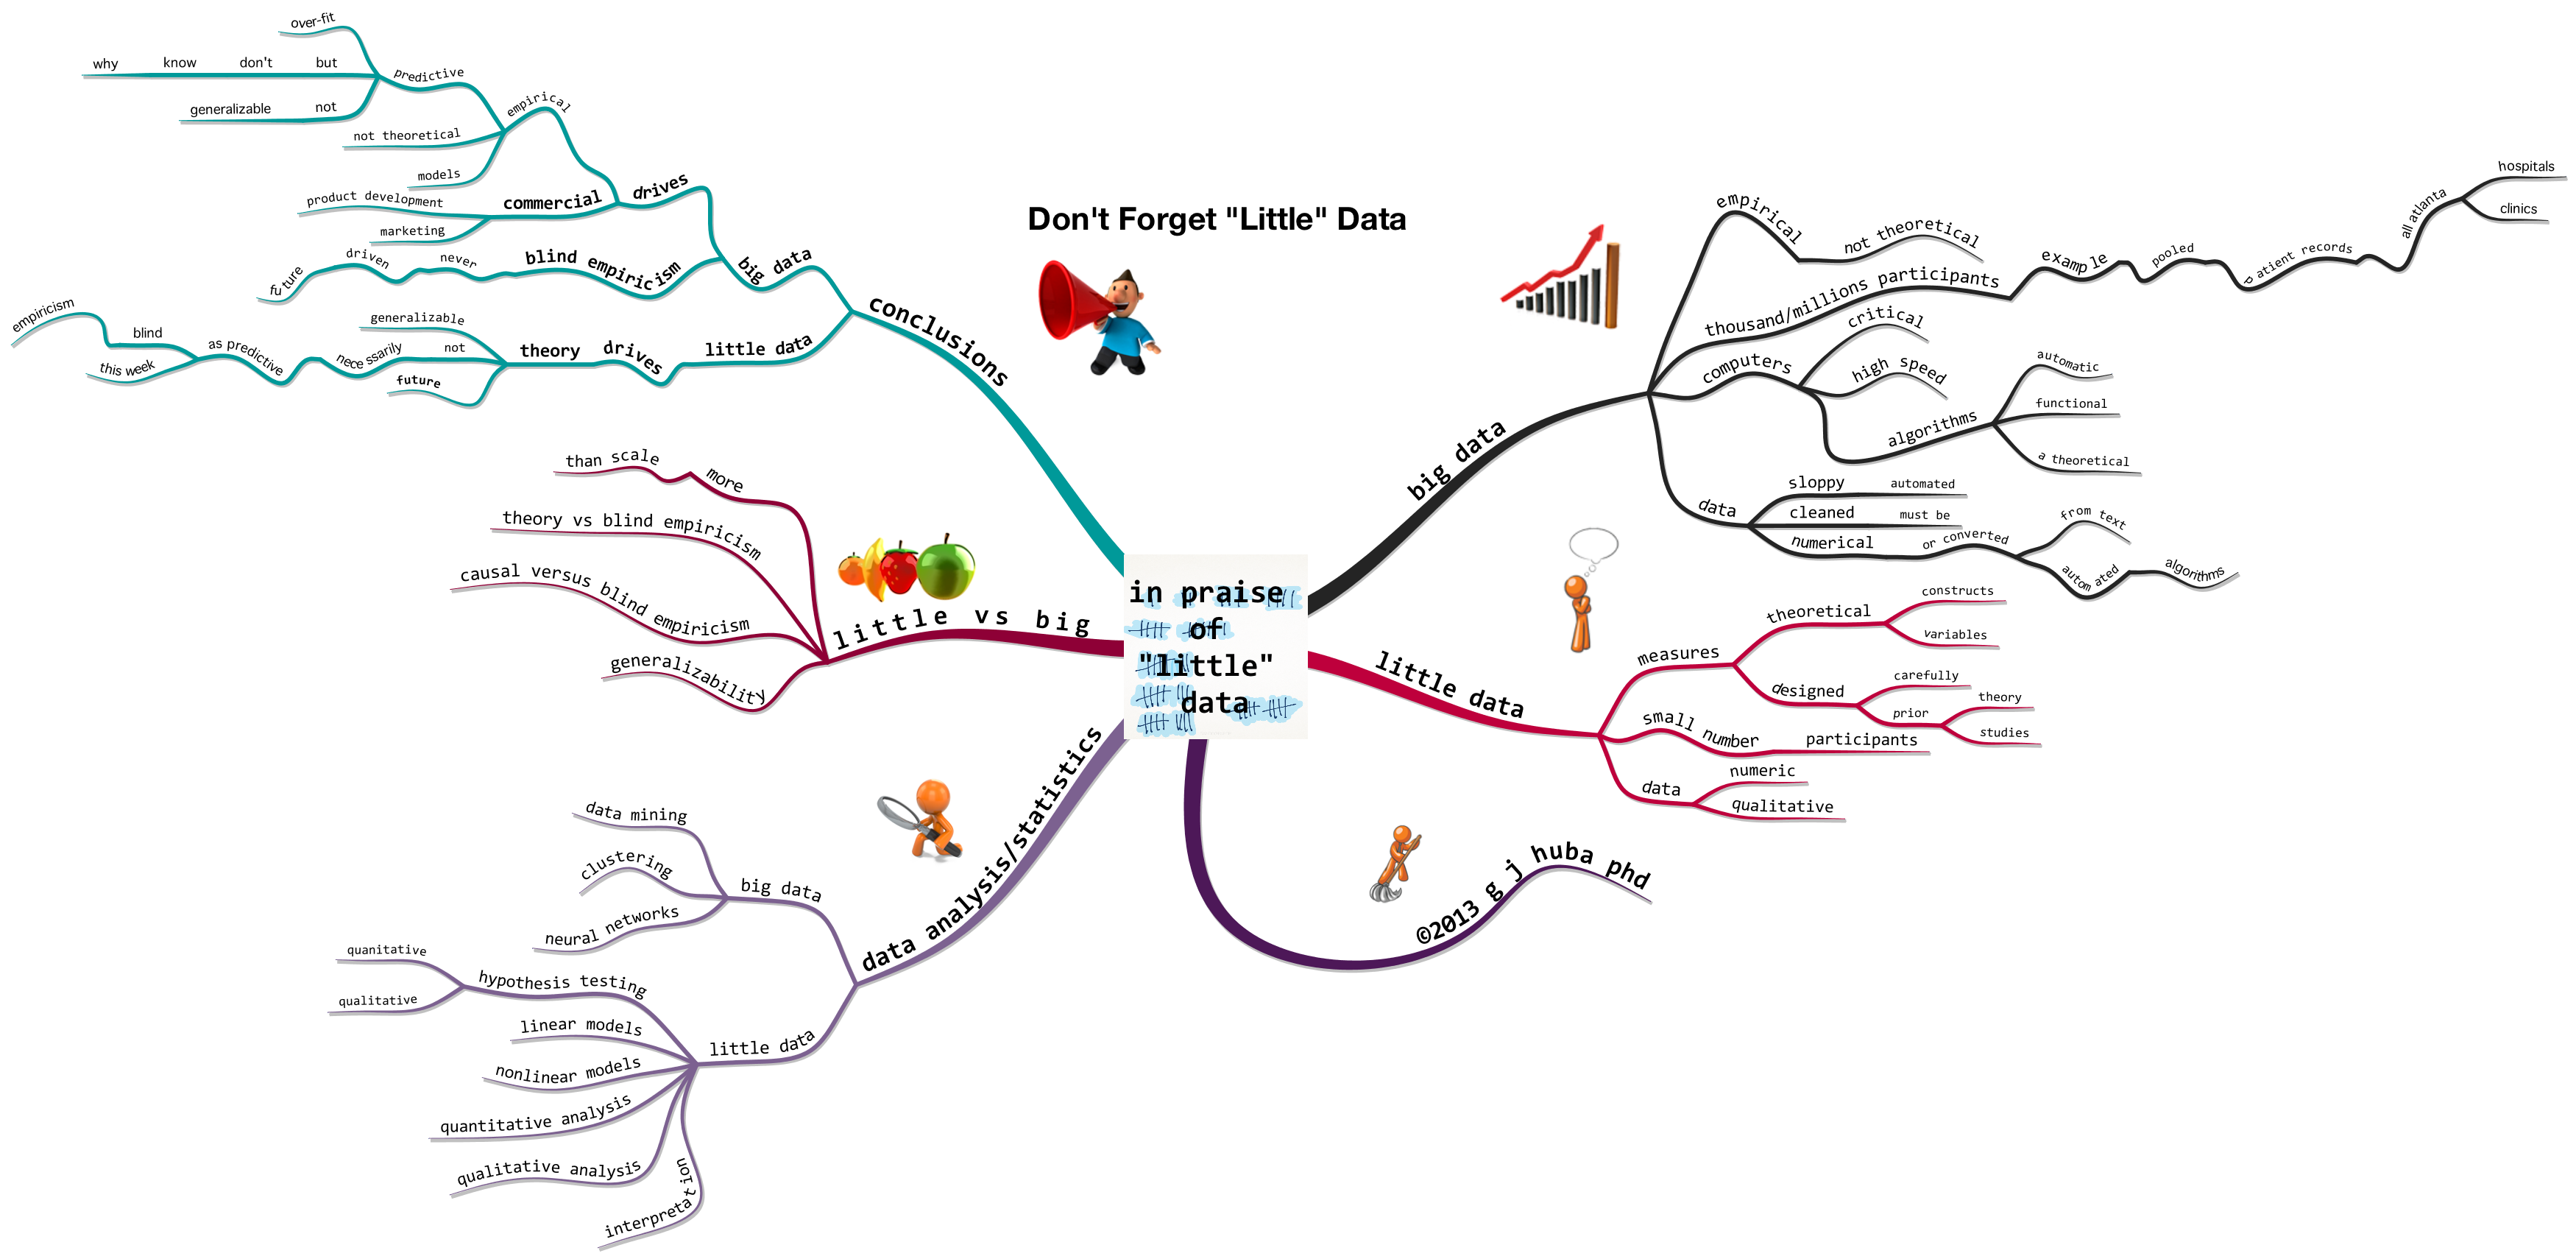
A few more thoughts are in the mind map below.

Click on the diagram to zoom.

copyright patent my life

Lawley and Maxwell’s book on factor analysis legitimized the psychometric development of factor analysis as a “real” statistical model. Although most now praise them for their breakthrough in deriving maximum likelihood estimators for the model parameters, I think the following sequence of photos shows Lawley and Maxwell’s great insight and most important contribution, received at the time as general heresy by the high priests of factor analysis.

I read this book around 1975. The paragraph I underlined and typed on the cover is one that significantly altered my career: I learned then, and further in the early 1980s, that statistical theories of psychological processes, at their very best, are only weak approximations to reality. At the time lots of psychometricians were giving their professional lives to determine if one blindly empirical factor rotation method was better than another since after all they were different by 3 percent and everyone had just “discovered” Joreskog and Sorbom’s work on structural equation modeling. I never spent more than 50 percent of my research time between 1977 and 1984 on psychometrics and statistics — the rest of the time went into modeling adolescent drug abuse behaviors and their precursors. In 1984 it was time to move on to 90 percent of my work being devoted to real psychological and social issues.

As for statistical-psychology theories, the fact that

  • it’s new
  • it’s hot
  • you can publish it a lot

does not sway me anymore.

Please click on the pictures to zoom.

Image

lawley maxwell 3

NOT

mantra of the  failed  academic researcher

[Context: After hundreds of articles in peer-reviewed publications over four decades, I think this is one of the more important ideas I have ever written about.]

I have been learning (and hopefully making creative developments to) the language “Mind Map.”

No, not how to draw mind maps. Rather, how to express myself through developing (which is more than drawing) a mind map in a computer program.

Expressing. Communicating content, knowledge, creative ideas. Summarizing huge amounts of knowledge in pictorial form. Even trying to be humorous with images and juxtapositions of words and pictures.

Why? Not everyone writes equally well irrespective of quality of education. Much knowledge is nonlinear in a world of linear languages. Even my writing style has been shifting to the kind of snappy short words found on Buzan-style mind maps and in length-limited languages like Twitter and Klingon. The language “Mind Map” might be especially useful for those who are not strong writers, those who want to be stronger writers by combining a spoken language and  the language “Mind Map,” those who age normally, those who age atypically, those who suffer from a head injury or brain disease, those who have various language problems, those who think visually, those who get distracted and cannot focus attention while writing in spoken languages. [Research is needed to support or reject these speculations.]

The language “Mind Map” is, for many, potentially “so easy a caveman can do it.” Whoops ….. they did.

cavestory4.png

caveman3

caveman4

Now shifting back to writing in “Mind Map.” Please click to expand.

writing in mind map

Notes:

  1. I believe the syntax for writing “Mind Map” by Tony Buzan and the translation program iMindMap by ThinkBuzan are the most effective to date.
  2. Probably the best “native writer” in “Mind Map” is Hans Buskes (@hansbuskes). Philippe Packu is also excellent. I think I am pretty good at it too and the theorist in the stadium.

This post does not contain psychological advice. If you are in need of psychological advice or services, see a local mental health provider or ask your primary care doctor for a referral. 

George Kelly was an American clinical psychologist in the middle of the 20th Century. Kelly developed one of the earliest cognitively-based, personality theories applicable to clinical and research settings.

Kelly’s Personal Construct Theory is a proposal that different individuals organize their perceptions of events, social relationships, objects, timelines, emotions in idiosyncratic ways. A personal construct system is the way that objects are clustered together or the set of dimensions along which objects are ranked by the individual. Mind maps are a good way to summarize the personal constructs of the individual.

Here is a series of six schema for grouping animals. There are, of course, many more ways to group these animals, and to explain what the groupings mean. Your way(s) of grouping these animals could be quite different.

Please click twice on the picture to see it at full size. A single graphic includes all six schema.

Schemata

If you think that there are a lot of different ways to group a few animals, consider the different ways that people might group (perceive) their acquaintances, ethical dilemmas, marital roles, work stressors, and justifications and priorities for spending money. Kelly’s theory was one of determining the personal construct systems of individuals and then helping them assess whether such ways of thinking were associated with positive or negative consequences within the present culture.

The underlying model of Personal Construct Theory is that “Each Person is a Scientist” making observations, organizing them, and using these schema to make decisions or observations that then influence emotion, social interaction, happiness, and perceived quality of life. Kelly stresses that the flexible individual is always seeking to test, validate, enhance, and expand the personal construct systems.

While a clinician and a client can draw diagrams to explain how the client appears to group ideas, it is also possible to use empirical (statistical, data analytic) means to do so. Kelly himself proposed an old data analysis method (P-technique factor analysis); better alternatives using present day methodologies are multidimensional scaling, cluster analysis, correspondence analysis, or ordinal factor analysis. These latter statistical techniques will be the subject of future posts.

The bottom line here is that mind maps are a very good way to visually portray personal construct systems. More about theoretical and methodological refinements in forthcoming posts.

I guess it’s just me … I search Google for sites with “psychology mind maps” and I get lotsa pages returned. Of course very FEW of these pages let you know where the ideas, recommendations, and organization comes from. That makes me pretty pissed off.

I have a simple rule for evaluating psycho-pop, psycho-babble, psycho-art, and psycho-schmaltz: if the author (artist, developer) cannot prove to me that the information came from a credible source and is being communicated by a credible source, I assume it is psycho-fantasy and just walk (actually run) away.

Here’s a few things to ask about before you go ahead and change your job, spouse, running shoes, or haircut because somebody gives you some magic MBTI letters, a number on a test published in a self-magazine, or advice that must be right because it appears in a pretty mind map.

I love great psychology content conveyed in an easy to understand manner. I hope I produce some. Most do not produce anything except profits. Know what you are buying (and staking your life on) when you get information from a book, TV, the Internet, text, or a graphic.

Please click on the diagram to zoom in.

Don't Believe a Psychology (Self Help) Mind Map Unless it Tells You

Irv Oii is known to many international news organizations and researchers as a star data journalist. Being a home worker (although home may be the UK, Ohio, the Middle East, Central Africa, Hong Kong, or Antartica) and a fairly reclusive person, nobody seems to have met Irv. Some speculate that he might be a Jewish Asian-American. Others believe Irv is short for Irvelina, a Russian immigrant physician who went to Ohio (or was it Ojai, California) when the Soviet science programs collapsed and turned into the lower funded Russian collaborative efforts with the EU and USA. The collapse of the Soviet Union resulted in the closing of her laboratory in Minsk. Some even think Irv Oii is an acronym.

Irv is thus an enigma and no pictures of her/him seem to exist. An artist’s conception (mine) based on the writings and consultations of Irv Oii on healthcare breakthroughs is shown below. My belief is that a portrait of Irv should hang over the desk of every data journalist and researcher.

Please click the image to zoom.

Irv Oii

Please click on the graphics to zoom.

it's program evaluation,  not research, dummy


3

evaluationmap

researchmap

Big data this, big data that. Wow. At the end we will have better ways to sell underwear, automobiles, and “next day” pills (although in the latter case politics and religion might actually trump Amazon and Google). Blind empiricism. Every time you click a key on the Internet it goes into some big database.

“Little data” — lovingly crafted to test theories and collected and analyzed with great care by highly trained professionals — has built our theories of personality, social interactions, the cosmos, and the behavioral economics of  buying or saving.

Big data drives marketing. Little data drives the future through generalizable theory.

Click on the figure below to zoom.

in praise of little data

Note: November 2015

I started writing about the importance of the content in the mind map — facts and important information well researched — back in November 2012. For the next few weeks I am intending to repost some of these posts with my updated thoughts about Mind Mapping 3.0 and what I would now call Mind Mapping 4.0. I will introduce Mind Mapping 4.0 after reviewing some of my views about Mind Mapping 3.0.]

It’s fine to put your own notes or feelings or ideas into a mind map that will be for your use or one which will be clearly labelled as you opinion. But, if you want to put ideas into general circulation as “facts,” you need to have done your homework and tie the information in the maps to established research, clinical findings, and expert opinion (and document whose expert opinion it is, whether that of someone else or yourself). Mind Mapping 3.0 was the introduction of high-quality data into this useful method of thinking.

George Huba

I would categorize the pioneering efforts of Tony Buzan and others to introduce and popularize the method of mind mapping as Mind Mapping 1.0 and the parameterizations and resulting computer programs by ThinkBuzan, Topicscape, Mindjet, and others as Mind Mapping 2.0.

[As I saw it in 2012 and continue to view it in 2015] Mind Mapping 3.0 is the integration of computer-assisted mind mapping methods, artistic sensibility to enhance visualization, AND MOST IMPORTANTLY, substantive, creative, well-documented valid and reliable content of great importance.

Click on the figure to expand.

Mind Mapping 3.0

There are a number of things that can be done to cut the cost of healthcare while, at the same time, freeing doctors and others to do their jobs better. These improvements cost almost nothing to implement [if all of the constituencies and politicians do not compete to be King Kong].

Visiting legislator who stumbled across this web page? Here’s your chance to act like a grown-up and represent the people of the world, not drug companies nor major research universities nor individual “researcher” egos and retirement funds.

Click on images to expand.[almost free] strategies to improve healthcare

Cartoon Rabbit - Giving A Thumbs Up

image

image

image

Sketchnote Example: My Predictions of Changes in the Field of Psychology Over The Next 20 Years

image

image

Click on the images to zoom.

The fictional detectives would have been great program evaluators. All looked at all types of data. Miss Marple was a model of pleasantry who could work her way into an organization or group and see it as it was without changing anything by observing. Holmes and Watson — whether in the original books and movies, the Ironman version of the movies, their current BBC incarnation in 21st Century London, or their CBS incarnation in 21st Century Manhattan with Dr John Watson now Dr Joan Watson (for the better) — use Holmes’ razor sharp mind and Watson’s intuitiveness and questioning. Sam Spade, wise cracks, an iron fist, and underlying sensitivity.

Program evaluation is not about conducting research, randomly assigning participants to conditions, or using quasi-experimental designs. Program evaluation is about understanding why programs produce certain outcomes, intended or not, positive or not, unique or not. To truly understand a program quantitative and qualitative data needs to be collected with great attention to the sensibilities, needs, risks, and potential confidentiality breaches of data of program participants, program staff, program administration, funders, and other stakeholders.

I love program evaluation. Every program is unique and at the same time representative of certain classes of human service organizations.

Be a detective. Look carefully and understand the beauty of a well-running program and how to help staff improve a program that is not working as well as it could.

evaluation detective work

A Life in Hats

Click on the image to enlarge it.

Symbols bring back a lot of memories. 1951 and being born (literally) in that tiny corner of the Bronx where Yankee Stadium faced the Polo Grounds (home of the New York, now San Francisco, Giants). My Dad told a story of studying for his college classes while caring for me as an infant and listening to the sounds coming from the two ball parks on the same summer evening. 1957 was the start of a life and elementary school in Massachusetts where my grandfather was the world’s longest suffering Boston Red Sox fan. In 1968 I left high school after 11th grade without graduating with the intention of being a physicist, discovered psychology soon thereafter, and graduated from Fordham College in 1972. In 1976 I left Yale after completing my PhD program. The Yale hat is the most important one of my life. 77 saw me at the University of Minnesota freezing my butt off and the next year I was in Los Angeles at UCLA warming it up. In 1980 I received my psychologist license and then went through the 1980s and 1990s as a committed, harried, stressed out Los Angeleno. In 1988 I started my own company and promptly appointed myself president. The 2000s were a time for becoming a committed North Carolinian, relaxing, and learning to say y’all. 9/11, of course, was the day most Americans started rethinking many issues in their lives.

The important part of this timeline is that these simple symbols mean a lot to ME and each evokes hundreds of direct memories and thousands of extended associations.

There is a lot to be said about trying techniques like this timeline to bring back cherished memories that you haven’t thought about in a while. Maybe the right symbols for you are concerts or movies or births or vacations or stages in the lives of your family members. Consider using symbols; a lot of our memories are encoded around images and not around words.

The University of Minnesota hat evokes some really funny stories like buying an ice cream cone in 20 degree weather (probably in October or April) from an outside vendor and walking down the street not having to worry about drips. Or playing marathon games of pinball or the first video games (pong, pacman) with a fellow assistant professor. That California Angels hat makes me think of standing in line from 2am on to purchase tickets for the American League (baseball) championships and then two or threes weeks later standing in line all night to get opening Saturday tickets for the Empire Strikes Back and becoming one of the first to know Darth Vader was Luke Skywalker’s father. Little things, big things, all stringing together in my memory from various symbols.

You might want to try this yourself. Works for me; may work for you too.

Aside 1: My grandfather had Alzheimer’s disease. Any time you put a Red Sox symbol in front of him you heard about Ted Williams, and the damn NY Yankees, and the Green Monster, and the times he took me to minor league baseball games as a kid, and how good (really bad) I was at baseball, etc. My baseball memories of him are those of the years before the dementia when he multi-tasked (in the 1960s) by having TWO different baseball games going on the radio at once (cacophony in that house) and a baseball game on TV. At times he was reading the then new magazine Sports Illustrated at the same time or the local sports section. If you asked him what had happened recently in any of the three games, he would tell you the last 10 plays or so or what Carl Yastremski had done in his at bats that day. And yes, he took me to at least 50 minor league (AA; Springfield Giants) baseball games every spring and summer. And I’m pretty sure he purchased a hot dog and popcorn for me at every game where we always sat in the same seats behind home plate.

Aside 2: If you look around my office or other living space, you will see that it is filled with small symbols that evoke memories (in my case baseball hats, pens, coffee mugs from meetings and vacations and schools, old office equipment in a big stack). If you look around most homes, you will see something parallel to my office. Why did you think we all patronize the souvenir shops at the national parks and airports and sports stadiums and try to keep our kids out but only half-heartedly? Symbols to organize and elicit memories.

The Program Evaluator's Tool Kit

Measure, Find Relationships, Communicate

image image

image image
Ask the Big Questions and Study How the Answers Relate to One Anotherimage

Decode Events and Naturally Occurring Data

image image

Examine in Detail

image

Listen
image

Find Patterns
image

This analysis, that analysis, yesterday’s analysis, tomorrow’s analysis, Uncle Izzy’s analysis … is there anything that is a not a form of analysis? Create your own bullshit anagram and bullshit detector. And then see how well it applies various politicians, political claims, the cable news stations, and others. You’re on your way to become a walking, human bullshit analyzer.

So without much further ado, a new form of analysis. And a make your own anagram template.

bullshit analysis

The Old …

image

The Current …

image

And the Ideal

image

  • Click on images to zoom.
  • Note that both the placement of the circles AND the front to back placement are significant and intentional.

This is the first of a series of posts I am making about program-organizational (and individual) evaluation. Much of what I will discuss is not in the mainstream of traditional program evaluation methodology.

My approach is different. It works.

In this first section the point is — obviously — that evaluation is iterative and nonlinear. This led to my first model that EVALUATION IS DETECTIVE WORK several decades ago. [Perhaps that explains my current obsession with all versions of Sherlock Holmes, whether in the original, present London, present New York, or by Iron Man.] At any rate, it seems ELEMENTARY to me that instead of thinking of program evaluation as a linear research experiment with a fixed design (a metaphor that works at best imperfectly), it is more important to treat evaluation as detective work where good rules of evidence must be followed and the evaluator is at fault if all outcomes are not found.

My initial development of the Detective Model in 1992 came from my observation that in much traditional program evaluation the evaluator applies a flawed “research” experimental model and the insensitivity of this approach means that a program looks worse than it is because the evaluation methodology is in error. Who pays for this problem? The program, of course, since the evaluator walks away saying that the “program sucks” and not that the evaluator screwed up. In the Detective Model, applied iteratively and nonlinearly, the evaluator and the program are partners, and it is clear what the responsibilities and level of success each has.

Seems ELEMENTARY to me.

As usual click on the image to zoom.

Evaluation is an Iterative, Non-linear Process

I was 10 years old when the Berlin Wall went up. 11 when JFK butchered the German language. 38 when the wall came down. 39 when they started selling the pieces. 62 when I finally saw some of the panels in person.

berlin wall time map

In person the panels proclaim desperation, depression, denial of freedom, hope, strength of the human spirit, persistence, creativity, and victory. Kind of puts most of my life in context. ACT UP.

The panels are part of the permanent collection at the Newseum in Washington, DC. Individual panels are 12 feet high and weigh several tons. The collection is the largest held by a public institution outside of Germany.

And, yes, the painted sides were on the western side. The backs are unpainted, blemished gray concrete.

Berlin Wall panels 355Berlin Wall panels 357Berlin Wall panels 358Berlin Wall panels 359Berlin Wall panels 361

When I was a child we used to have the drills you have seen in those odd videos where kids dove under their desks when the nuclear alarm sounded. The Berlin Wall made the fears of the time much worse. My elementary school also had a basement with a sign on the stairs that said fall-out shelter and had the big radioactive sign that led you to believe that the basement would protect you against direct radiation and fall-out. Good thing there were no nuclear attacks and the public at large never realized that a desk or basement was not going to protect you at all. [At the time, my own father was one of the first nuclear engineers in the USA and never told us or anyone else that it was a big government scam; it probably was a result of his high-level security clearance for reactor design.] And in case you wonder about profits from the fake bomb shelters, the US  government subsidized the peanut farmers and put hundreds of gallons of peanut butter in large cans inside of the bomb shelters. When they did tile ceiling tile repairs in my office at UCLA in the early 1980s, the maintenance crew used the peanut butter as glue, and apparently that was a common construction practice at the time! Who knows what else the owners of the buildings with the fake bomb shelters did with this stuff as it passed its expiration date. The 40-year “Cold” War was a pretty nasty one that scared me until the day the Wall came down. The end to the Cold War was a singular achievement of the Reagan Administration, the UK, and our European allies who proved to the Soviet Union that they could not keep up with the western coalition in sustained military spending without totally pissing off their citizens by making them accept sub-standard lifestyles.

And yes, later President Jimmy Carter benefited from both ends of the Cold War radiation industry serving in the navy as a very early nuclear officer [at the time my father was designing submarine reactors and training nuclear officers] on a submarine and later selling subsidized peanuts. Perhaps this has something to do with Carter’s ascendance as a peace advocate after his presidency.

Look around at the restaurant or on the subway or on airplanes or at bicycle riders (yup, see it a lot around here) or at store workers or person in the car next to you at the red light or in television shows and at businesspeople, teens, tweens, older adults, hospital patients, hospital doctors,  athletes, the disabled, those wearing the most trendy clothes and those dressed in all black with black hats/scarves. Data is streaming into all of their lives: email, texts, videos, music, e-magazines and e-newspapers, web sites world wide, Twitter, Facebook, Instagram, and the local restaurant’s menu. Netflix, iTunes, Amazon Prime, your bank, your doctor, your pharmacy, your local fast food purveyor, extra news and feeds from the sporting event you are attending, the latest Kardashian kamikazi komedy.

The video game is the work of the Devil.

With the exception of an increasingly small percentage of individuals with unlimited data because they were early adopters and have not changed their cellular plans, most of us are paying by the gigabyte. Those with free plans are throttled so that they really cannot use an unlimited amount of data for a fixed price so the fixed prices will go away soon.

Drop data prices, streaming will expand exponentially, the phone companies will make even more money, you will never see your friends in the flesh anymore, family dinners as we knew them in 1960 or even 1980 will be dead and replaced by family members sitting at the same table eating junk food and each watching their own data stream, and no one will want to go to the movie theater or red box anymore. Even the Columbian cocaine lords may go out of business.

Data overload will lead to data addiction and probably result in humanity evolving into the Borg Collective.

Borg

We need to make some changes before Skynet and the Terminators become inevitable.

skynet


terminators

I think the human race has no more than 30 years to evolve before the bytes take over. It will make the “War on Drugs” seem like the good old days and war with the Cylons inevitable. If you thought Big Pharma was going to control your life by promising the end to pain and disease, think again. Big Wireless will be even more insidious and the way Big Pharma has increased healthcare costs significantly will turn out to have been smaller than wireless when the historians look back in 100 years. Wireless data streaming is already starting to become the crack of the next decades.

Turn the Devil’s toys off when you: go home, go to dinner, watch TV, are in a meeting, are in a class, are in a place of religious observances, go on vacation, go to bed, take a shower, go into the bathroom (yup, your screaming boss may be in a toilet stall at DFW or ORD), or go to a friend’s home. Get out of the habit of pulling your cell phone out to take a picture of your family and then checking your email or Twitter account while you are at it. And stop modeling the “cellular data comes before everything else” lifestyle to your kids.

Even Spock turned the data stream off sometimes. Do so and “Live Long and Prosper.”

I confess. In 1979 Pete Bentler and I published an article entitled “Simple Minitheories of Love” in the highest prestige journal on personality and social psychology.

Blame it on the exploits of the greatest psychometrician of his generation and a 28 year-old wanna-be psychometrician, both active personality researchers, trying to convince the field that the new statistical modeling methods (Structural Equation Models; LISREL) they were testing would revolutionize the field (I was wrong on that one, too).

Now ask yourself why neither of these guys — nor any of the other main figures in the fields of psychometrics, sociometrics, personality, social psychology, attraction research — ever went on to start a web site to match individuals on the basis of personality and life style questionnaires (I won’t dignify them by calling them tests); such sites became quite lucrative. This was in spite of the fact that at least one (Huba) had the opportunity to do so during the years when he was the Vice President of R&D for a major psychological testing company and later when most of the other competing testing companies hired him as consultant. Or why did the major personality test developer of his generation and the owner of a psychological testing company (the late Doug Jackson) never consider developing such a product?

See a pattern here? Even the folks who made the most $$$ from psychological instruments and had the most influence in the psychological assessment journals and industry did not develop a Love Site.

I concede that a Love Site may be a good place to find people you might not never meet otherwise through your social and work friends and these might be good mates or sex partners. Or they might be psychopaths, perpetuators of sexual or domestic violence, dependent individuals, or alcoholics.

So far as I can tell from the undisclosed algorithms of the dating sites and their unpublished outcomes, I have no way of knowing for sure if the sites have a good chance of producing a good outcome and avoiding a terrible (and life-threatening) one. I suspect that if there were strong scientific evidence that the sites “work” in both cases, there would be a lot of scientific research published that supports this notion. Where is the incontrovertible evidence? Can I can read it or hear it at professional conventions? Claims on TV that a lot of people got married mean little or nothing without information about comparison groups or negative outcomes.

I would have no problem concluding that the Love Sites are effective if there were psychometric and other scientific evidence that the algorithms used are valid. Without such evidence, I worry that they are more voodoo and “smoke and mirrors” than places where you can find a mate and your date will not result in a rape. Of course I cannot prove my position is right, but neither can the Love Sites. My stance is safer for individuals.

There is that old fashioned system of “meet and greet and respect the people you meet” that did produce so many humans that we now have a problem with world-wide population growth. Sometimes older methods work better if you are patient.

Love Sites