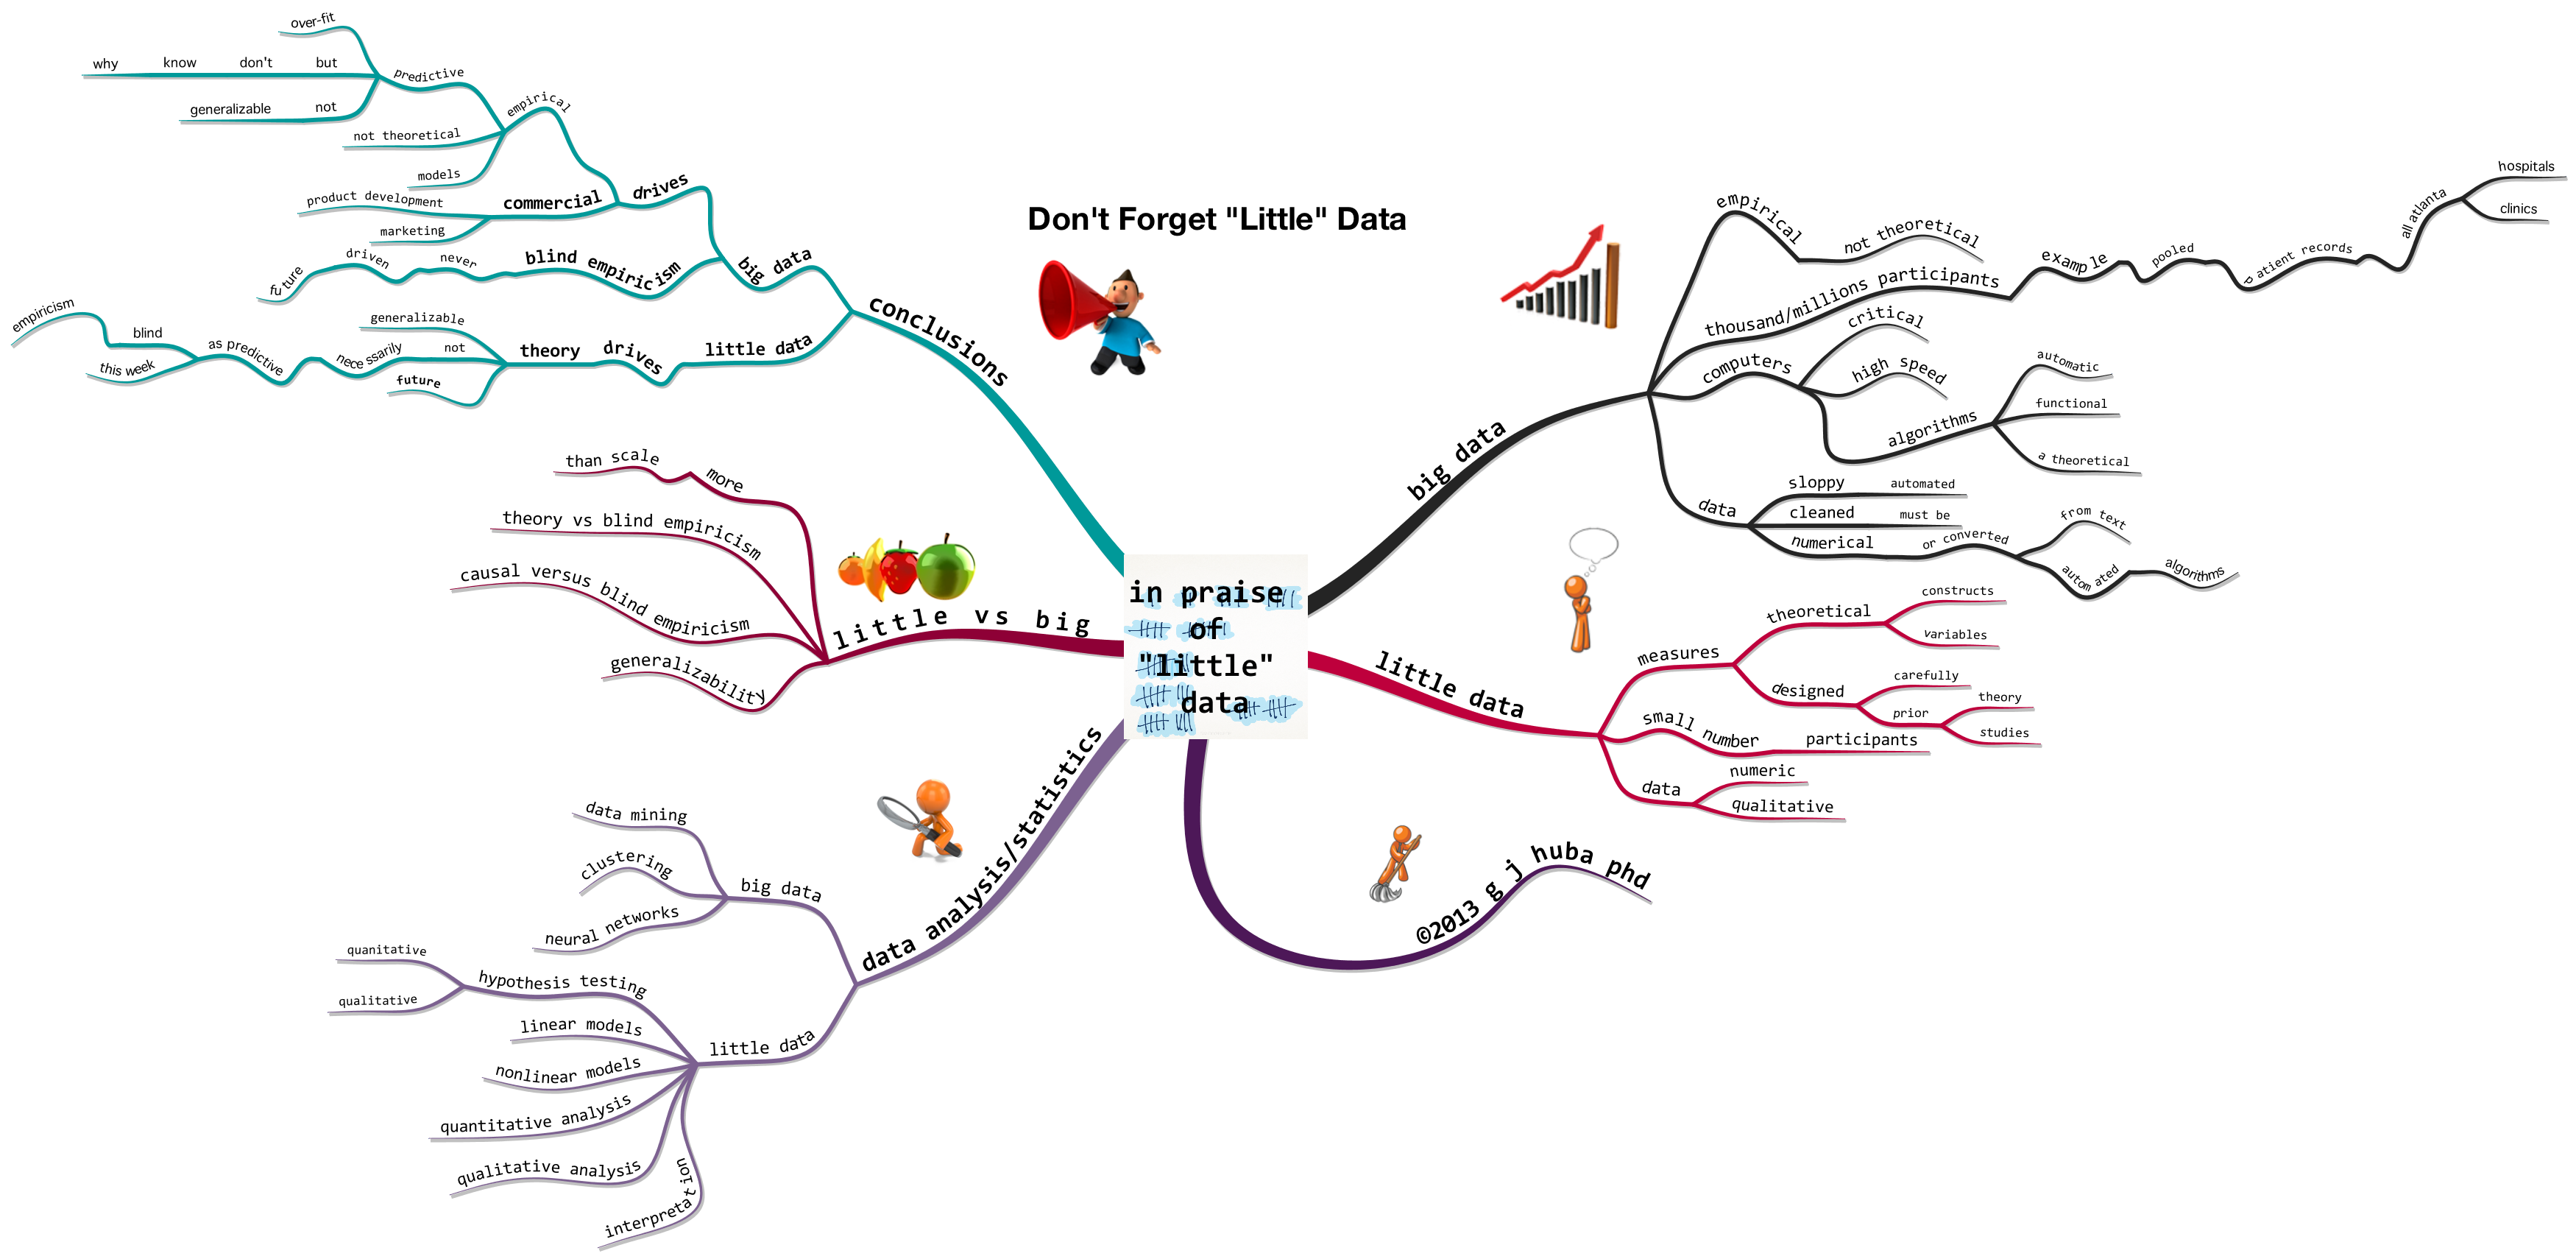
Big data this, big data that. Wow. At the end we will have better ways to sell underwear, automobiles, and “next day” pills (although in the latter case politics and religion might actually trump Amazon and Google). Blind empiricism. Every time you click a key on the Internet it goes into some big database.
“Little data” — lovingly crafted to test theories and collected and analyzed with great care by highly trained professionals — has built our theories of personality, social interactions, the cosmos, and the behavioral economics of buying or saving.
Big data drives marketing. Little data drives the future through generalizable theory.
For two years I have argued that mind maps can be (are) good ways to summarize complicated research into easily-understood theoretical models. The mind map below has gone through a few iterations since 2010. This is my version of November 25 2012. All pictures are of the same map.
iMindMap is in the very highest tier of the mind map programs. There are no mind map programs that surpass it; some argue that a couple of others are in the same tier. Of the high tier programs this is my favorite and the one that best matches the mind maps I like to use for writing, expressing ideas, brainstorming, and now for making presentations.
iMindMap version 6.1 was released as a free upgrade from v6.0 on November 1, 2012. The update is great and any iMindMap user should be installing it now. Everything works a little better and a little faster and the user experience is improved as it always is with one of their upgrades. I like the fact that the developer of this program (ThinkBuzan) keeps releasing free updates every few months between the major versions (4.0, 5.0, 6.0, etc.).. I have found that each of the upgrades over the past two years has been one which introduces new features.
The “killer” feature in v6.1 is the fact that the iMindMap program now makes incredible presentations that can be prepared in the usual two dimensions or three dimensions just by clicking a button. It’s that easy. It works. Presentations look super-duper and the 3-D graphics can be very easily navigated through an on-screen “joy stick” mechanism. But wait, there’s more. The program now permits you to prepare self running kiosk presentations (video files) or to prepare and upload YouTube videos. The kiosk files can also be uploaded to your own web site although it should be noted that the files, even for small maps at lower resolutions, tend to be in excess of one gigabyte. Because of their size, in many cases it will be necessary to store the presentations on YouTube (as private or public files).
iMindMap v6.1 is a giant step forward. Here is one of my maps as a presentation from v6.1. The map is also a statement of how I think this technique needs to be used: content is the Queen.
I think the 3-D options in the new iMindMap are super-duper, although I do recommend you play with the program for an hour because there are little tricks you can find to make the 3-D mind maps (and their presentations) more artistic and more easily understood. The 3-D maps do benefit from a slightly different approach to map design than one would take for a 2-D map. Here are just a few 3-D pictures of the same mind map (with various branches condensed.
Ok, why not 4-D maps incorporating the passage of time?. Of course you can do this although it is not mentioned in the iMindMap materials. The fourth dimension can be added by using the 3-D or kiosk presentation modes AND adding color coding to show how branches get added, deleted, or re-organized over time. It does require the presentation mode to represent time. I leave it to someone more gifted in geometry than I to figure out the 5-D mind map.
You heard it here first (just kidding): PowerPoint is dead. The linear structure of PowerPoint neither approximates reality very well nor keeps the audience awake. iMindMap presentations better represent the nonlinear structure of most things, events, and people, and can keep the audience on the edge of their seats by having them guess what is coming next. The addition of 4-D in this program is natural and fairly easy.
PowerPoint is dead. There IS a just god. Abe Lincoln was a great orator (see below).
To receive ongoing information about iMindMap, on Twitter follow @GriffithsThinks for theoretical and design issues and @iMindMap for practical issues and retweets of other mind mapping information.
=====
In case you think I was a little late in proclaiming PowerPoint’s demise, you are correct. Abe Lincoln (with a little help from the acclaimed computer scientist Peter Norvig) said it (apologies to Honest Abe).