A powerful set of tools for journaling are those that create visualizations depicting data, ideas, facts, research, news, evaluations, comments, polls, opinions, feelings, planning, communications, and models of many things. And any other things you can visualize.
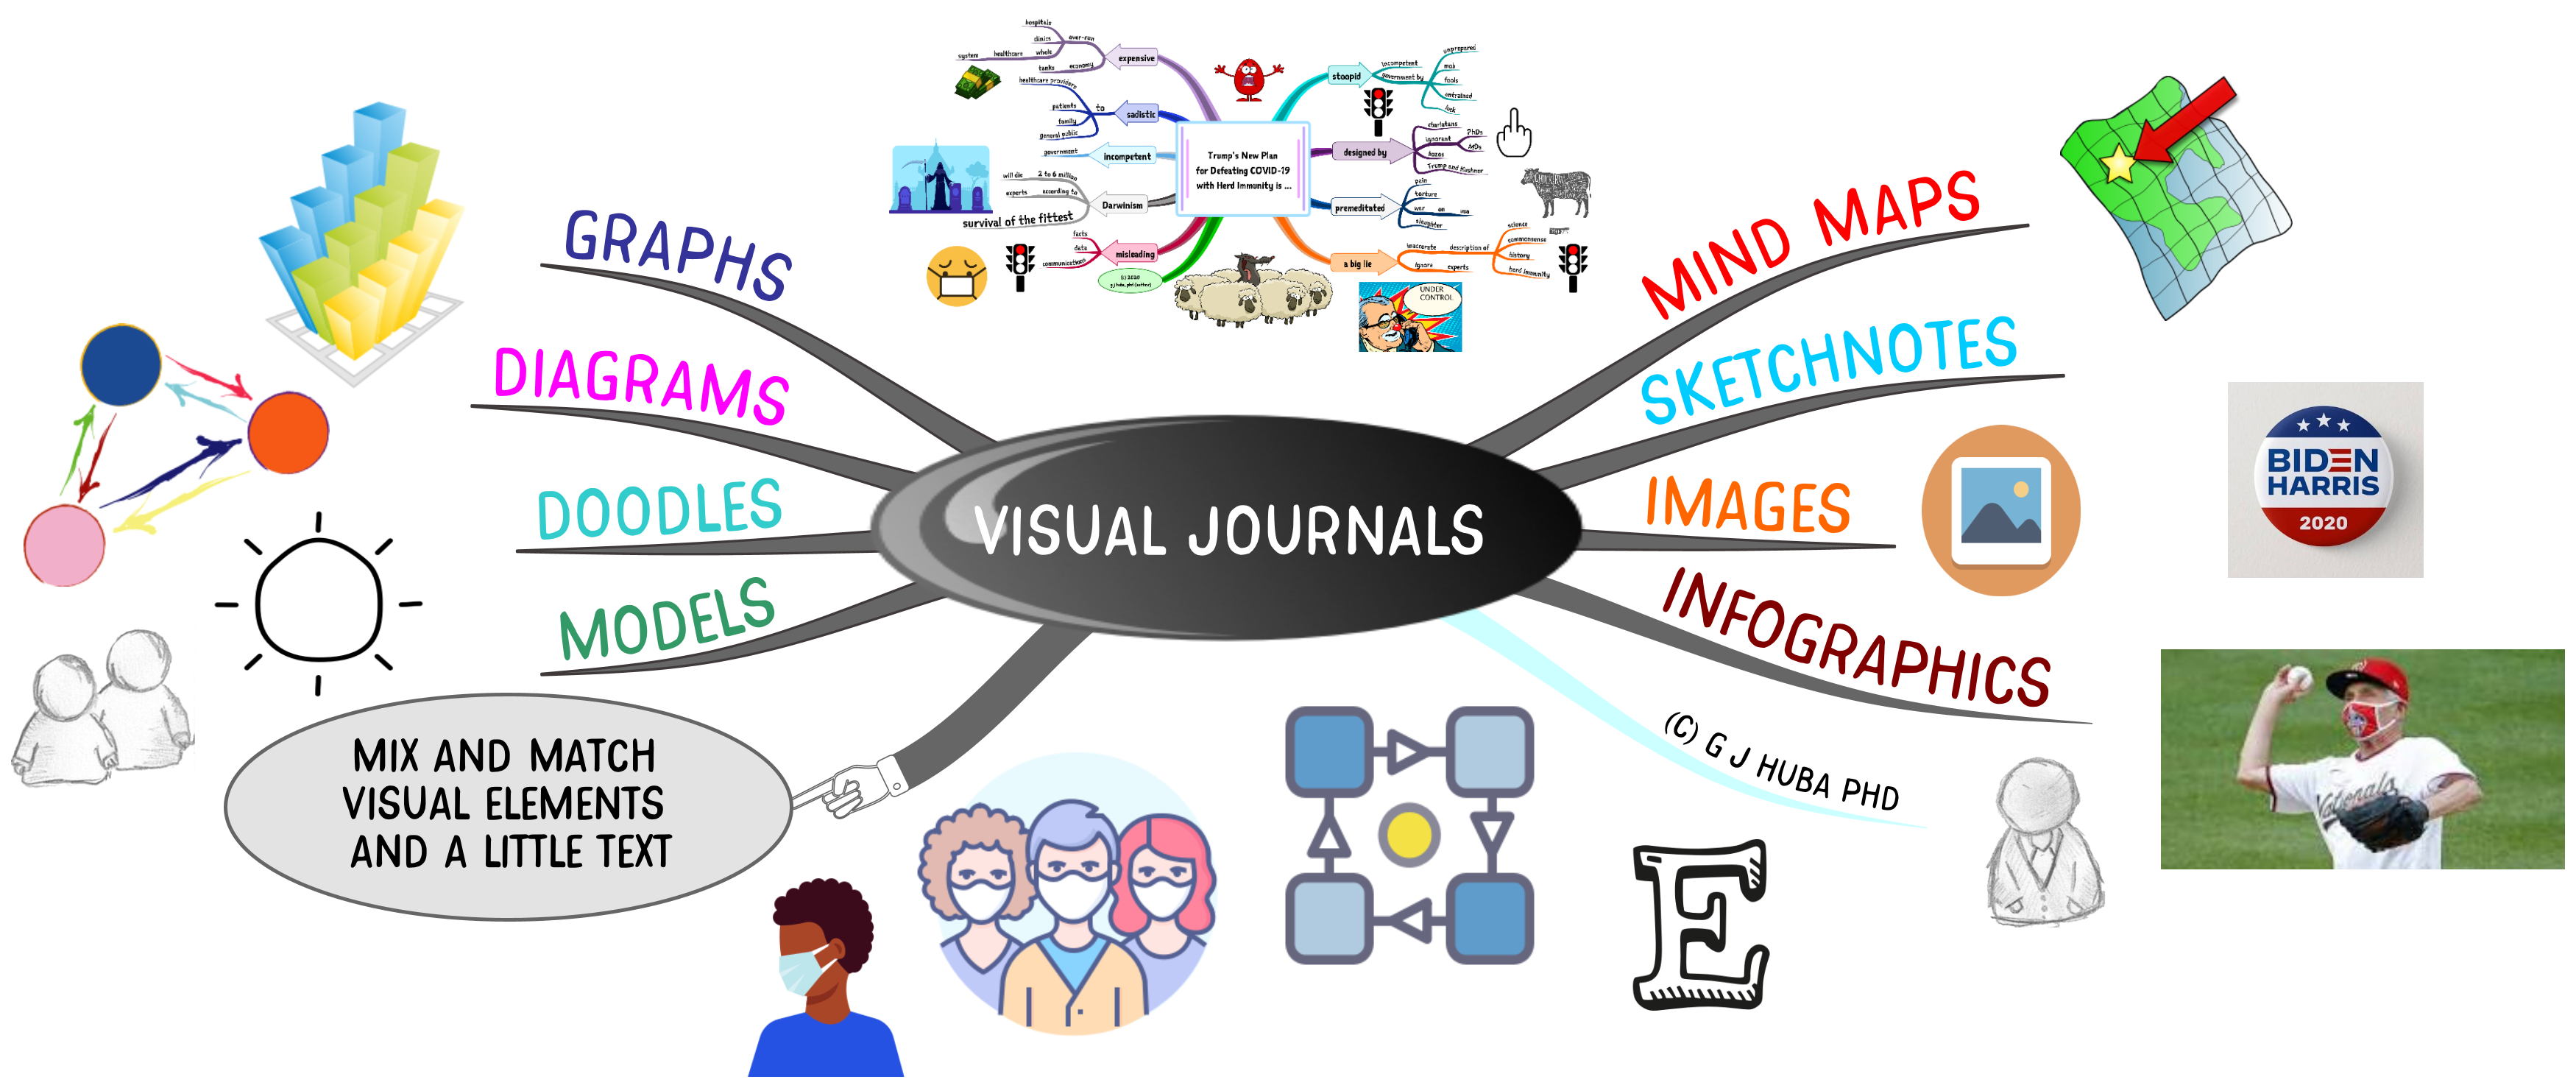
Visual data of varying types can be visualized as graphs, diagrams, doodles, models, mind maps, sketchnotes, images, and infographics along with many other types of visual displays.
Visual thinking is underused by those who need to understand and synthesize information for themselves and others. Such methods should be taught and used throughout our educational systems.
Click on the image below to expand it.